We use cookies to improve security, personalize the user experience, enhance our marketing activities (including cooperating with our marketing partners) and for other business use.
Click "here" to read our Cookie Policy. By clicking "Accept" you agree to the use of cookies. Read less
Read more
Accept
Loading
Form preview
  • US Legal Forms
  • Form Library
  • More Forms
  • More Uncategorized Forms
  • Practice B Scatter Plots And Trend Lines

Get Practice B Scatter Plots And Trend Lines

Name Date Class LESSON 151 Practice B Scatter Plots and Trend Lines Graph a scatter plot using the given data. 1. The table shows the percent of people ages 1824 who reported they voted in the presidential.

How it works

  1. Open form

    Open form follow the instructions

  2. Easily sign form

    Easily sign the form with your finger

  3. Share form

    Send filled & signed form or save

How to fill out the Practice B Scatter Plots And Trend Lines online

Filling out the Practice B Scatter Plots And Trend Lines form is a straightforward process that allows users to create visual representations of data through scatter plots and trend lines. This guide will provide a step-by-step approach to ensure that users complete the form accurately and efficiently.

Follow the steps to effectively complete the Practice B form.

  1. Press the ‘Get Form’ button to access the document and open it in your preferred online editor.
  2. Begin by entering your name in the designated field at the top of the form.
  3. Next, input the date to ensure your work is properly dated.
  4. Fill in your class information in the provided space.
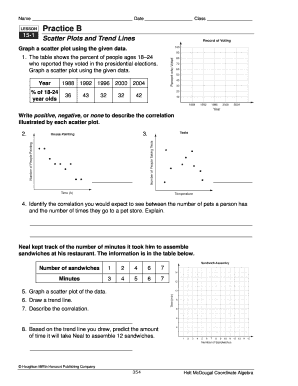
  5. For the first question, graph a scatter plot using the data provided regarding the percentage of 18-24-year-olds who voted in presidential elections from 1988 to 2004.
  6. In the section that asks for the correlation, indicate whether it is positive, negative, or none based on the information graphed.
  7. Proceed to the next section, where you will describe the expected correlation between the number of pets a person has and their visits to a pet store, providing an explanation.
  8. Refer back to the table regarding Neal's sandwich assembly times. Create a scatter plot using the number of sandwiches as your x-axis and the assembly time as your y-axis.
  9. Draw a trend line through the plotted data points of Neal's assembly times.
  10. Finally, predict the time it would take Neal to assemble 12 sandwiches based on the trend line and provide your answer in the designated space.
  11. Once completed, review your responses, then save your changes or download, print, and share the form as needed.

Complete your Practice B Scatter Plots And Trend Lines online today!

Get form

Experience a faster way to fill out and sign forms on the web. Access the most extensive library of templates available.
Get form

Related content

Unit 5 Overview v 3.0 - CT.gov
In investigation two, students will be introduced to scatter plots and trend lines....
Learn more
Mcdougal Algebra 1 Practice B Resource Answers |...
Nov 13, 2020 — Practice B 12-2 Circles - MR. ALLEN Practice B - Mr. Gonzalez's Algebra...
Learn more
Instructions - UserManual.wiki
It's always a good practice to keep the raw data (the first worksheet) intact. ... Plot...
Learn more

Related links form

Software Form Filler Printable Advance Directive Form Michigan Wage Loss Verification Form Cuna Mutual Group Change Of Beneficiary Form

Questions & Answers

Get answers to your most pressing questions about US Legal Forms API.

Contact support

In the example above, we had Excel calculate and plot a linear trendline through the points. You should notice that the trendline is the best line that fits through the points. It may or may not actually pass through any particular points. That's why another name for trendline is best-fit line.

Use a linear trendline when your data increases or decreases along a straight line at a constant rate. For example, if your chart displays a steady increase in revenue by product line over time, you could use a linear trendline.

Scatter plots show how much one variable is affected by another. The relationship between two variables is called their correlation. There are three types of correlation: positive, negative, and none (no correlation).

A trendline is most accurate when its R-squared value (R-squared value: A number from 0 to 1 that reveals how closely the estimated values for the trendline correspond to your actual data. A trendline is most reliable when its R-squared value is at or near 1.

Trendline reliability A trendline is most reliable when its R-squared value is at or near 1. When you fit a trendline to your data, Graph automatically calculates its R-squared value. If you want, you can display this value on your chart.

Scatterplots are as useful for finding a relationship between variables as they are for making predictions. Here, you will make a trend line, or a line that best describes the data on a scatterplot, in order to estimate unknown outputs for given inputs.

3D scatter plots are used to plot data points on three axes in the attempt to show the relationship between three variables. Each row in the data table is represented by a marker whose position depends on its values in the columns set on the X, Y, and Z axes.

0:20 2:02 How to add Trendline and R squared Equation in Scatter Plot in Excel YouTube Start of suggested clip End of suggested clip The data go to insert tab. And plot the scatter plot. Now i will arrange. This since the data pointMoreThe data go to insert tab. And plot the scatter plot. Now i will arrange. This since the data point starts from 150 i will make it 150.

Examining X-Y (Scatter) Plots The Title. The title offers a short explanation of what is in your graph. ... The Legend. The legend tells what each point represents. ... The Source. The source explains where you found the information that is in your graph. ... Y-Axis. ... The Data. ... X-Axis.

0:00 8:08 Equation of a Trend Line - Scatterplot - YouTube YouTube Start of suggested clip End of suggested clip Every point you don't even have to connect a point just go straight through the middle. And it'sMoreEvery point you don't even have to connect a point just go straight through the middle. And it's going off.

Get This Form Now!

Use professional pre-built templates to fill in and sign documents online faster. Get access to thousands of forms.
Get form
If you believe that this page should be taken down, please follow our DMCA take down processhere.

Industry-leading security and compliance

US Legal Forms protects your data by complying with industry-specific security standards.
  • In businnes since 1997
    25+ years providing professional legal documents.
  • Accredited business
    Guarantees that a business meets BBB accreditation standards in the US and Canada.
  • Secured by Braintree
    Validated Level 1 PCI DSS compliant payment gateway that accepts most major credit and debit card brands from across the globe.
Get Practice B Scatter Plots And Trend Lines
Get form
Form Packages
Adoption
Bankruptcy
Contractors
Divorce
Home Sales
Employment
Identity Theft
Incorporation
Landlord Tenant
Living Trust
Name Change
Personal Planning
Small Business
Wills & Estates
Packages A-Z
Form Categories
Affidavits
Bankruptcy
Bill of Sale
Corporate - LLC
Divorce
Employment
Identity Theft
Internet Technology
Landlord Tenant
Living Wills
Name Change
Power of Attorney
Real Estate
Small Estates
Wills
All Forms
Forms A-Z
Form Library
Customer Service
Terms of Service
Privacy Notice
Legal Hub
Content Takedown Policy
Bug Bounty Program
About Us
Blog
Affiliates
Contact Us
Delete My Account
Site Map
Industries
Forms in Spanish
Localized Forms
State-specific Forms
Forms Kit
Legal Guides
Real Estate Handbook
All Guides
Prepared for You
Notarize
Incorporation services
Our Customers
For Consumers
For Small Business
For Attorneys
Our Sites
US Legal Forms
USLegal
FormsPass
pdfFiller
signNow
airSlate WorkFlow
DocHub
Instapage
Social Media
Call us now toll free:
+1 833 426 79 33
As seen in:
  • USA Today logo picture
  • CBC News logo picture
  • LA Times logo picture
  • The Washington Post logo picture
  • AP logo picture
  • Forbes logo picture
© Copyright 1997-2025
airSlate Legal Forms, Inc.
3720 Flowood Dr, Flowood, Mississippi 39232