We use cookies to improve security, personalize the user experience, enhance our marketing activities (including cooperating with our marketing partners) and for other business use.
Click "here" to read our Cookie Policy. By clicking "Accept" you agree to the use of cookies. Read less
Read more
Accept
Loading
Form preview
  • US Legal Forms
  • Form Library
  • More Forms
  • More Uncategorized Forms
  • Linear Functions Unit Portfolio

Get Linear Functions Unit Portfolio

Name Date Linear Functions Unit Portfolio Directions Complete each of the tasks outlined below. Cab companies often charge a flat fee for picking someone up and then charge an additional fee per mile driven. Pick a U.S. city and research the rates of two different cab companies in that city. Find companies that charge different amounts per mile and have different flat fees. If you have trouble finding this information for two companies you can make up what you think would be reasonable prices for a cab s flat rate and a cab s rate per mile. Task 1 a* For the first company express in words the amount the cab company charges per ride and per mile. b. Write an equation in slope-intercept point-slope or standard form* Explain why you chose the form you did* c* What do the slope and y-intercept mean in the context of this problem Hint What do you pay when you step into the cab Task 2 For the second company express in a table the cost of the cab ride given the number of miles provided* Numbe....

How it works

  1. Open form

    Open form follow the instructions

  2. Easily sign form

    Easily sign the form with your finger

  3. Share form

    Send filled & signed form or save

How to fill out the Linear Functions Unit Portfolio online

This guide provides detailed instructions on completing the Linear Functions Unit Portfolio online. By following these steps, users can effectively input their responses for each task and submit the form successfully.

Follow the steps to complete your portfolio accurately.

  1. Press the ‘Get Form’ button to access the form and open it in the editor.
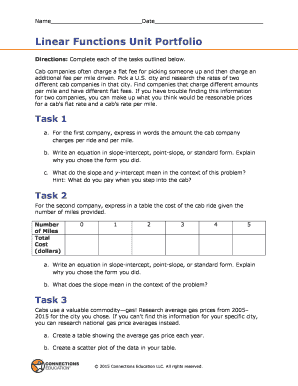
  2. Begin with Task 1: Choose a U.S. city and find the rates of two different cab companies. If you have difficulty finding the rates, you may create reasonable estimates for the flat fees and per mile charges. Provide a written expression for the first company’s charges and write an equation in the selected form. Explain your choice.
  3. For the first company, describe what the slope and y-intercept represent within this context. Consider what you pay when you enter the cab.
  4. Move on to Task 2: For the second cab company, express the cost of a cab ride as a table based on the number of miles. Complete the table with values for 0 to 5 miles.
  5. Write an equation in a slope-intercept, point-slope, or standard form. Provide justification for your choice and explain the meaning of the slope in this scenario.
  6. Proceed to Task 3: Conduct research on average gas prices from 2005 to 2015 for the selected city. If this is not feasible, use national averages.
  7. Create a table reflecting the average gas prices for each year and then generate a scatter plot based on this data.
  8. Determine an equation that models the gas price data. Identify the domain and range of this equation and discuss the fit of the model to the data.
  9. Analyze trends in the gas price data. Discuss whether there is a positive, negative, or nonexistent correlation and predict the gas price for 2020, providing reasoning for your prediction.
  10. Once all tasks are completed, review your entries, save any changes made, and then download, print, or share your portfolio as necessary.

Start completing the Linear Functions Unit Portfolio online today!

Get form

Experience a faster way to fill out and sign forms on the web. Access the most extensive library of templates available.
Get form

Related content

11113_AR1301-AMTH-Gr3-8 11_FINAL.indd - Arkansas...
The success of the Arkansas Alternate Portfolio Assessment depends upon ... table (from...
Learn more
Section 1.3: Linear Functions - Business Calculus
The graph is increasing in a straight line from left to right because for each mile the...
Learn more
A Practical Guide To Quantitative Portfolio...
5.4.1 Unit-root nonstationarity . ... 13.6.2 Relating MSR to cost function based market...
Learn more

Related links form

CUNY Off-Campus Activity Participation And Waiver And Emergency Contact Form (Domestic Travel) 2018 1199SEIU Funds Summary Plan Description 2019 OR Form 5252OR 2017 SUNY At Fredonia Verification Worksheet Dependent 2019

Questions & Answers

Get answers to your most pressing questions about US Legal Forms API.

Contact support

In Mathematics, a linear function is defined as a function that has either one or two variables without exponents. It is a function that graphs to the straight line.

First, find the y-intercept (b), which is the point where the line crosses the y-axis. Next, choose two points on the graph and find the slope (m) using the formula. Finally, write the equation of the line using y = mx + b.

In mathematics, linear relationships can be modeled using functions in the form y = mx + b, where m represents the slope and b represents the y-intercept. By plugging in different x values, corresponding y values can be generated and plotted on a graph.

Linear functions are those whose graph is a straight line. A linear function has one independent variable and one dependent variable. The independent variable is x and the dependent variable is y. a is the constant term or the y intercept.

Using a Given Input and Output to Build a Model Identify the input and output values. Convert the data to two coordinate pairs. Find the slope. Write the linear model. Use the model to make a prediction by evaluating the function at a given x-value. Use the model to identify an x-value that results in a given y-value.

Using the slope-intercept form: If you have a table of x and y values, you can use the slope-intercept form (y = mx + b) to find the equation for x. You can use the two points to find the slope (m) and the y-intercept (b) of the line.

What is the formula for linear model? The formula for a linear model is y=mx+b. The y represents the output value, the m represents the rate of change, the x represents the input value, and the b represents the constant.

A linear function can be modeled by determining the difference between any two consecutive values. This is the difference by which the value of the function change. This difference can also be used to determine the initial value upon which the changes happens.

Get This Form Now!

Use professional pre-built templates to fill in and sign documents online faster. Get access to thousands of forms.
Get form
If you believe that this page should be taken down, please follow our DMCA take down processhere.

Industry-leading security and compliance

US Legal Forms protects your data by complying with industry-specific security standards.
  • In businnes since 1997
    25+ years providing professional legal documents.
  • Accredited business
    Guarantees that a business meets BBB accreditation standards in the US and Canada.
  • Secured by Braintree
    Validated Level 1 PCI DSS compliant payment gateway that accepts most major credit and debit card brands from across the globe.
Get Linear Functions Unit Portfolio
Get form
Form Packages
Adoption
Bankruptcy
Contractors
Divorce
Home Sales
Employment
Identity Theft
Incorporation
Landlord Tenant
Living Trust
Name Change
Personal Planning
Small Business
Wills & Estates
Packages A-Z
Form Categories
Affidavits
Bankruptcy
Bill of Sale
Corporate - LLC
Divorce
Employment
Identity Theft
Internet Technology
Landlord Tenant
Living Wills
Name Change
Power of Attorney
Real Estate
Small Estates
Wills
All Forms
Forms A-Z
Form Library
Customer Service
Terms of Service
Privacy Notice
Legal Hub
Content Takedown Policy
Bug Bounty Program
About Us
Blog
Affiliates
Contact Us
Delete My Account
Site Map
Industries
Forms in Spanish
Localized Forms
State-specific Forms
Forms Kit
Legal Guides
Real Estate Handbook
All Guides
Prepared for You
Notarize
Incorporation services
Our Customers
For Consumers
For Small Business
For Attorneys
Our Sites
US Legal Forms
USLegal
FormsPass
pdfFiller
signNow
airSlate WorkFlow
DocHub
Instapage
Social Media
Call us now toll free:
+1 833 426 79 33
As seen in:
  • USA Today logo picture
  • CBC News logo picture
  • LA Times logo picture
  • The Washington Post logo picture
  • AP logo picture
  • Forbes logo picture
© Copyright 1997-2025
airSlate Legal Forms, Inc.
3720 Flowood Dr, Flowood, Mississippi 39232