We use cookies to improve security, personalize the user experience, enhance our marketing activities (including cooperating with our marketing partners) and for other business use.
Click "here" to read our Cookie Policy. By clicking "Accept" you agree to the use of cookies. Read less
Read more
Accept
Loading
Form preview
  • US Legal Forms
  • Form Library
  • More Forms
  • More Uncategorized Forms
  • Scatter Plot Assessment Tool - Special Connections

Get Scatter Plot Assessment Tool - Special Connections

Scatter Plot Assessment Tool Date Name of Person Observed: Observer: Behavior(s):.

How it works

  1. Open form

    Open form follow the instructions

  2. Easily sign form

    Easily sign the form with your finger

  3. Share form

    Send filled & signed form or save

How to fill out the Scatter Plot Assessment Tool - Special Connections online

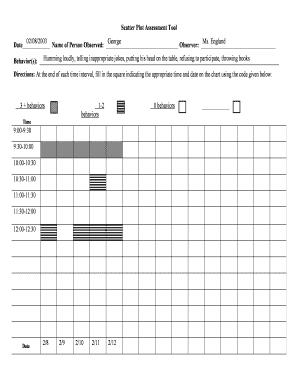
The Scatter Plot Assessment Tool - Special Connections is designed to help users document and analyze behaviors over specific time intervals. This guide provides clear, step-by-step instructions for filling out the form online, ensuring accurate and comprehensive data collection.

Follow the steps to successfully complete the assessment tool.

  1. Click ‘Get Form’ button to obtain the form and open it in the editor.
  2. Begin by filling in the 'Name of Person Observed' field with the individual's name, ensuring correct spelling.
  3. Enter the 'Date' of observation in the designated space, noting the format for clarity.
  4. In the 'Observer' section, provide your name or the name of the person documenting the behaviors.
  5. Identify and summarize the behaviors observed. Write a brief description of the behaviors in the 'Behavior(s)' field. Be as specific as possible.
  6. For each time interval listed, observe and document the frequency of behaviors during that period by placing a checkmark or filling in the appropriate square based on the code provided.
  7. Complete the 'Date' rows for each observation, ensuring you accurately reflect the days observations were made.
  8. After completing the form, review each section for accuracy before proceeding.
  9. Once satisfied with the entries, you can save your changes, download the form, print it, or share it as needed.

Start completing your Scatter Plot Assessment Tool - Special Connections online today!

Get form

Experience a faster way to fill out and sign forms on the web. Access the most extensive library of templates available.
Get form

Related content

1.3.3.26. Scatter Plot
Check for Relationship, A scatter plot (Chambers 1983) reveals relationships or...
Learn more
Scatter Plot - Special Connections - The...
The scatter plot is a direct observation tool used in the functional assessment process to...
Learn more
User Guide - Connect Math
Use the Item Analysis report in the Gradebook to drive discussion on subsequent classes...
Learn more

Related links form

Debate Score Sheet 2020 Hospital Medical Record Statistics Form 2020 Sentence Starters For Your Readers Notebook 2020 Graphing Activities Mr Buckley Answer Key 2020

Questions & Answers

Get answers to your most pressing questions about US Legal Forms API.

Contact support

Scatter plots' primary uses are to observe and show relationships between two numeric variables.

Describing scatterplots (form, direction, strength, outliers)

Zero or no correlation: A correlation of zero means there is no relationship between the two variables. In other words, as one variable moves one way, the other moved in another unrelated direction.

No association means that there is no line and all the dots are scattered. Nonlinear association means that the dots are close to each other but are not in a line.

If the data points make a straight line going from near the origin out to high y-values, the variables are said to have a positive correlation. If the data points start at high y-values on the y-axis and progress down to low values, the variables have a negative correlation.

A scatterplot with no correlation has data that does not follow a pattern, neither positive nor negative. The scatterplot shows haphazard points that follow no direction. For example, there are three points, (35,50), (50,35), and (70,50).

The closer the data points come to forming a straight line when plotted, the higher the correlation between the two variables, or the stronger the relationship. If the data points make a straight line going from near the origin out to high y-values, the variables are said to have a positive correlation.

In a scatterplot, the data points are plotted but not joined. The resulting pattern indicates the type and strength of the relationship between two or more variables. Chart 5.6. 1 is an example of a scatterplot.

Get This Form Now!

Use professional pre-built templates to fill in and sign documents online faster. Get access to thousands of forms.
Get form
If you believe that this page should be taken down, please follow our DMCA take down processhere.

Industry-leading security and compliance

US Legal Forms protects your data by complying with industry-specific security standards.
  • In businnes since 1997
    25+ years providing professional legal documents.
  • Accredited business
    Guarantees that a business meets BBB accreditation standards in the US and Canada.
  • Secured by Braintree
    Validated Level 1 PCI DSS compliant payment gateway that accepts most major credit and debit card brands from across the globe.
Get Scatter Plot Assessment Tool - Special Connections
Get form
Form Packages
Adoption
Bankruptcy
Contractors
Divorce
Home Sales
Employment
Identity Theft
Incorporation
Landlord Tenant
Living Trust
Name Change
Personal Planning
Small Business
Wills & Estates
Packages A-Z
Form Categories
Affidavits
Bankruptcy
Bill of Sale
Corporate - LLC
Divorce
Employment
Identity Theft
Internet Technology
Landlord Tenant
Living Wills
Name Change
Power of Attorney
Real Estate
Small Estates
Wills
All Forms
Forms A-Z
Form Library
Customer Service
Terms of Service
Privacy Notice
Legal Hub
Content Takedown Policy
Bug Bounty Program
About Us
Blog
Affiliates
Contact Us
Delete My Account
Site Map
Industries
Forms in Spanish
Localized Forms
State-specific Forms
Forms Kit
Legal Guides
Real Estate Handbook
All Guides
Prepared for You
Notarize
Incorporation services
Our Customers
For Consumers
For Small Business
For Attorneys
Our Sites
US Legal Forms
USLegal
FormsPass
pdfFiller
signNow
airSlate WorkFlow
DocHub
Instapage
Social Media
Call us now toll free:
+1 833 426 79 33
As seen in:
  • USA Today logo picture
  • CBC News logo picture
  • LA Times logo picture
  • The Washington Post logo picture
  • AP logo picture
  • Forbes logo picture
© Copyright 1997-2025
airSlate Legal Forms, Inc.
3720 Flowood Dr, Flowood, Mississippi 39232