Loading
Get Cytobank: Titrations Quick Guide
How it works
-

Open form follow the instructions
-

Easily sign the form with your finger
-

Send filled & signed form or save
How to fill out the Cytobank: Titrations Quick Guide online
This guide provides clear instructions on how to effectively fill out the Cytobank: Titrations Quick Guide. It is designed to assist users at all levels in navigating the titration setup process efficiently.
Follow the steps to complete your titration setup.
- Press the ‘Get Form’ button to access and open the Cytobank: Titrations Quick Guide online.
- Upload your own FCS files or clone an existing experiment. To clone, find an approved dataset, such as the CD4 titration experiment, and use the 'Clone FCS files' link.
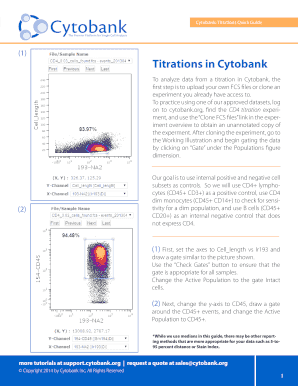
- Begin data gating by selecting ‘Gate’ under the Populations figure dimension after accessing the Working Illustration.
- Set the axes to Cell_length vs Ir193. Draw a gate similar to the provided picture and use ‘Check Gates’ to verify its accuracy across samples.
- Change the Active Population to intact cells and adjust the y-axis to CD45. Draw a gate around the CD45+ events and set the Active Population to CD45+.
- Adjust the axes to CD3 vs CD20, gating the B cells (CD3- CD20+) and CD3+ lymphocytes (CD3+ CD20-).
- Set the Active Population to CD3+ lymphocytes and switch the axes to CD4 vs CD8a. Select the CD4_0_cells_found file from the File/Sample Name pulldown menu and establish a CD4 single positive gate.
- While maintaining the CD3+ lymphocytes as the Active Population, set the axes to CD8a vs CD20 and define the CD3+ CD8a- gate.
- Adjust the axes to CD45 vs CD14, set the Active Population to CD45+, and create a gate around CD14+ events, naming it Monocytes.
- Select ‘Apply and Return’ to go back to the Working Illustration. Activate the figure dimension by clicking ‘Conditions’ and assign files to staining conditions by entering and adding the specified conditions.
- Choose the CD3+ CD8- population under Populations and select CD4 under Channels. Update the Illustration after adjusting the y-axis to CD45.
- Save this figure as CD3+ Dot Plots, and then return to the Working Illustration.
- Change the plot from Density Dot to Histogram Overlay and save this figure as CD3+ Histogram Overlay.
- On the Experiment Overview page, click on ‘Export Statistics Tool’ and proceed to define export settings by adding conditions and desired statistics.
- Once you have added all desired statistics, click ‘Export’ and upon completion, download the file to open it in your preferred spreadsheet program.
- Determine the optimal concentration of antibody by analyzing the difference between signal and noise in a line chart and selecting the concentration with the largest distance between the populations.
Complete your Cytobank: Titrations Quick Guide online today for accurate data analysis!
Closing and settlement are often used interchangeably, but they are not exactly the same thing. Closing is the final step of the transaction, where the buyer and the seller sign the documents and exchange the keys. Settlement is the process of transferring the title, paying the fees, and recording the deed.
Industry-leading security and compliance
US Legal Forms protects your data by complying with industry-specific security standards.
-
In businnes since 199725+ years providing professional legal documents.
-
Accredited businessGuarantees that a business meets BBB accreditation standards in the US and Canada.
-
Secured by BraintreeValidated Level 1 PCI DSS compliant payment gateway that accepts most major credit and debit card brands from across the globe.