Loading
Get Algerbra 1b Pratice Box Plot And Outlier Rule
How it works
-

Open form follow the instructions
-

Easily sign the form with your finger
-

Send filled & signed form or save
How to fill out the Algebra 1B practice: Box plot and outlier rule online
This guide provides clear instructions on how to effectively fill out the Algebra 1B practice form focused on box plots and outlier rules. Following these steps will help users complete the form accurately and efficiently.
Follow the steps to fill out the form successfully.
- Click the ‘Get Form’ button to obtain the form and open it in the editing interface.
- Begin by entering your name in the designated space indicated by 'Name _____________________'. This personal identification is essential for your submission.
- Next, fill in your block number in the field labeled 'Block _____'. This ensures proper class grouping and organization.
- Indicate the date in the section 'Date ___________'. This helps keep track of when the practice was completed.
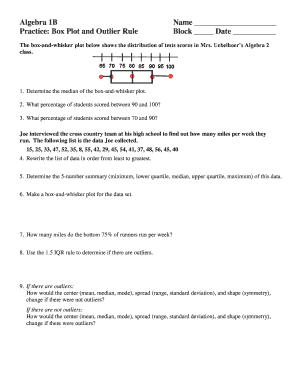
- Move on to analyze the box-and-whisker plot provided. Determine the median of the distribution based on the plot information.
- Calculate the percentage of students who scored between 90 and 100. This involves interpreting the data visually from the box-and-whisker plot.
- Similarly, calculate the percentage of students who scored between 70 and 90 by examining the same plot.
- Next, you will be organizing the data provided from Joe's interview. Rewrite the miles he documented in ascending order from least to greatest.
- Once ordered, determine the 5-number summary: minimum, lower quartile, median, upper quartile, and maximum.
- Create a box-and-whisker plot for the newly arranged data set based on the statistics gathered.
- Assess how many miles the bottom 75% of runners run by evaluating the data.
- Utilize the 1.5 IQR rule to check for any outliers within the data collection.
- Reflect upon the presence of outliers. Describe how the center (mean, median, mode), spread (range, standard deviation), and shape (symmetry) would alter if outliers were present or absent.
- Analyze the parallel box-and-whisker plot for Miami and New Orleans to discern which city has a greater range of average monthly rainfall.
- Explain how the parallel box-and-whisker plot aids in comparing the ranges of rainfall between the two cities.
- In the last steps, determine rainfall percentages for specified ranges in both Miami and New Orleans, and record your findings accurately.
- For Mrs. Hagan's data on height, compute the 5-number summary and create another box-and-whisker plot based on the recorded heights.
- Identify between which heights the middle 50% of the girls in Mrs. Hagan's class fall.
- Apply the 1.5 IQR rule again to find any outliers in this segment of data.
- Conclude by noting how the center, spread, and shape of the data would change in the presence or absence of outliers.
- After completing all sections, users can save their changes, download the completed form, print it, or share it as needed.
Complete and submit the Algebra 1B practice form online today to enhance your understanding of box plots and outlier rules.
In a box plot, we draw a box from the first quartile to the third quartile. A vertical line goes through the box at the median. The whiskers go from each quartile to the minimum or maximum. A box and whisker plot with the left end of the whisker labeled min, the right end of the whisker is labeled max.