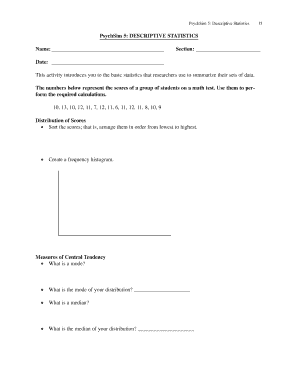
PsychSim 5: Descriptive Statistics 15 PsychSim 5: DESCRIPTIVE STATISTICS Name: Section: Date: This activity introduces you to the basic statistics that researchers use to summarize their sets of data.
Open form follow the instructions
Easily sign the form with your finger
Send filled & signed form or save
How to fill out the PsychSim 5 DESCRIPTIVE STATISTICS Name Section Date - Bxscience online
This guide provides a comprehensive overview of filling out the PsychSim 5 Descriptive Statistics form. By following these detailed instructions, users will be able to complete the form accurately and effectively.
Follow the steps to complete the form accurately.
- Locate and press the 'Get Form' button to access the PsychSim 5 Descriptive Statistics form. This will allow you to retrieve the form and open it for completion.
- In the first blank field labeled 'Name', enter your full name. This identifies you as the user completing the form.
- In the 'Section' field, write the section number or name relevant to your course or curriculum.
- In the 'Date' field, insert the current date when you are completing the form. This provides context for when the data was collected.
- Following the header, you will find a set of scores. Review them carefully: 10, 13, 10, 12, 11, 7, 12, 11, 6, 11, 12, 11, 8, 10, 9.
- To perform the required calculations, first sort the scores in ascending order. This step helps in understanding the distribution.
- Next, create a frequency histogram to represent the data visually. This aids in identifying patterns in the scores.
- For measures of central tendency, define 'mode', then determine the mode of your score distribution. Write your answer in the provided space.
- Define 'median' and calculate its value based on your sorted scores. Record this in the relevant field.
- Define 'mean' and explain how it is calculated. Then proceed to calculate the mean for your distribution and show your calculations in the designated area.
- Discuss which measure of central tendency is most appropriate for skewed distributions and provide a rationale based on your analysis.
- For measures of variability, define 'range' and calculate it based on your scores, writing the result in the appropriate spot.
- Lastly, define 'standard deviation' and explain how it is obtained. Provide the necessary calculations if required.
- Once all sections have been completed, review your responses for accuracy. You can then save changes, download, print, or share the completed form as necessary.
Complete your PsychSim 5 Descriptive Statistics form online to enhance your understanding of data analysis.
Experience a faster way to fill out and sign forms on the web. Access the most extensive library of templates available.
Related content
The numbers below represent the scores of a group of students on a math test. Use them to...
Get answers to your most pressing questions about US Legal Forms API.
What is an example of a descriptive statistic in psychology?
The most commonly reported descriptive statistics in psychology research are the mean and the range. An example of how this would be reported is “The number of participants recruited in the study was 10, aged 18- 27 (M = 22.8 & SD = 8.12) ”.
What are the five descriptive statistics?
Descriptive statistics are broken down into measures of central tendency and measures of variability (spread). Measures of central tendency include the mean, median, and mode, while measures of variability include standard deviation, variance, minimum and maximum variables, kurtosis, and skewness.
How do you describe descriptive statistics in APA?
Descriptive Statistics Mean and Standard Deviation are most clearly presented in parentheses: • The sample as a whole was relatively young (M = 19.22, SD = 3.45). The average age of students was 19.22 years (SD = 3.45).
What are the four types of descriptive statistics?
There are four major types of descriptive statistics: Measures of Frequency: * Count, Percent, Frequency. ... Measures of Central Tendency. * Mean, Median, and Mode. ... Measures of Dispersion or Variation. * Range, Variance, Standard Deviation. ... Measures of Position. * Percentile Ranks, Quartile Ranks.
What is the example of descriptive and inferential statistics?
Examples on Descriptive and Inferential Statistics Example 1: The scores of 2 groups of students belonging to different classes are noted. Using descriptive and inferential statistics see which group exhibits a higher variability in performance. Solution: To describe the variability in performance the variance is used.
How to perform descriptive statistics in SPSS?
Descriptive statistics for continuous variables Click on Analyze\Descriptive Statistics\Descriptive. Move the variables you would like to analyse into the Variables box. Click on the options button to make sure mean, standard deviation, minimum, maximum, skewness and kurtosis are selected. Click OK.
What is descriptive statistics AP psychology?
Descriptive statistics involves the use of numerical data to measure and describe the characteristics of groups, and this includes measures of central tendency and variation.
What is a good example of a descriptive statistic?
A student's grade point average (GPA), for example, provides a good understanding of descriptive statistics. The idea of a GPA is that it takes data points from a wide range of exams, classes, and grades, and averages them together to provide a general understanding of a student's overall academic performance.
Use professional pre-built templates to fill in and sign documents online faster. Get access to thousands of forms.
If you believe that this page should be taken down, please follow our DMCA take down process here.