We use cookies to improve security, personalize the user experience, enhance our marketing activities (including cooperating with our marketing partners) and for other business use.
Click "here" to read our Cookie Policy. By clicking "Accept" you agree to the use of cookies. Read less
Read more
Accept
Loading
Form preview
  • US Legal Forms
  • Form Library
  • More Forms
  • More Uncategorized Forms
  • Sample Blood Fridge Maintenance Record Form Template (pdf)

Get Sample Blood Fridge Maintenance Record Form Template (pdf)

Blood Fridge Maintenance Record BS41A Sept 2014 Fridge identification Moonaree Hospital Hospital Name: Asset No: 123321 Month: September 2014 Year: Daily maintenance checks 1 Record blood fridge temperature.

How it works

  1. Open form

    Open form follow the instructions

  2. Easily sign form

    Easily sign the form with your finger

  3. Share form

    Send filled & signed form or save

How to fill out the Sample Blood Fridge Maintenance Record Form Template (pdf) online

Filling out the Sample Blood Fridge Maintenance Record Form Template is crucial for maintaining proper blood storage practices. This guide provides step-by-step instructions to help users complete the form accurately and efficiently online.

Follow the steps to complete the maintenance record form accurately.

  1. Click 'Get Form' button to obtain the form and open it in the editor.
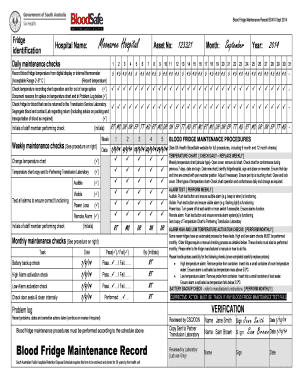
  2. Identify the fridge by filling in the hospital name and asset number at the top of the form. Ensure that the information is accurate.
  3. Specify the month and year for which the maintenance checks are being recorded. This helps in maintaining a clear timeline of checks.
  4. For daily maintenance checks, record the blood fridge temperature from the digital display or internal thermometer. Ensure the temperature is within the acceptable range of 2-6° C.
  5. Check the temperature recording chart's operation and look for any out-of-range spikes. Document the reasons for any spikes in the Problem Log section that follows.
  6. Examine the fridge for blood that can be returned to the Transfusion Service Laboratory. Segregate it and contact the Lab for further instructions.
  7. Complete the weekly and monthly maintenance checks as outlined. Initial next to each task upon completion, ensuring that no tasks are overlooked.
  8. After completing the necessary checks, review the problems identified and corrective actions taken in the Problem Log.
  9. At the end of the form, ensure all required signatures are provided, including those of the staff members performing checks and the laboratory representatives.
  10. Once completed, save the changes, download, print, or share the form as required for your records.

Complete your Blood Fridge Maintenance Record online today for efficient management and compliance.

Get form

Experience a faster way to fill out and sign forms on the web. Access the most extensive library of templates available.
Get form

Related content

Specimen Collection Handbook - SAMHSA
This manual does not apply to specimens submitted for testing under U.S. ... The Federal...
Learn more
gp2-a2 template - Johns Hopkins Pathology
Feb 1, 2009 — POLICIES AND PROCEDURES MANUAL. Document ... on the refrigerator...
Learn more
User Guide - Medtronic Diabetes
Symptoms of high blood glucose include fatigue, excessive thirst ... HelpLine at...
Learn more

Related links form

Prior Auth Request Bformb Community Phys 1 22 14 - CenterLight Bb - Centerlighthealthcare VIII. Appendix A - Acknowledgement/Receipt Form - Resources Fbcc Name Period Date Adding And Subtracting Integers Word Problems - Moodle Baylorschool Moving Man Lab Pdf

Questions & Answers

Get answers to your most pressing questions about US Legal Forms API.

Contact support

Logarithmic scales are useful when the data you are displaying is much less or much more than the rest of the data or when the percentage differences between values are important. You can specify whether to use a logarithmic scale, if the values in the chart cover a very large range.

Creating a Log Log Chart in Excel Select the data that you want to plot. Click the Insert tab, and then click Scatter. Click Scatter with only Markers. Click OK. Right-click the x-axis, and then click Format Axis. Under Axis Type, click Logarithmic scale. Click OK. Right-click the y-axis, and then click Format Axis.

If Y = log(y) and X = log(x) then Y = nX. This shows the linear relationship. Plotting Y against X, i.e., log(y) against log(x), leads to a straight line as shown below.

Pick input values (that is, x-values) that are powers of the base; for instance, if the log's base is 5, then pick x-values like 52 and 5−1. List the corresponding y-values; for instance, log5(52) = 2 = y and log5(5−1) = −1 = y. Plot the points, taking care not to have the graph cross the vertical asymptote.

To create a Log-Log plot in base R we pass log(data) as data argument instead of data in the plot() function. The log() function converts the data value into its logarithmic value. The log() function by default calculates the natural logarithms.

The logarithmic scale is useful for plotting data that includes very small numbers and very large numbers because the scale plots the data so you can see all the numbers easily, without the small numbers squeezed too closely.

0:23 8:58 Forming an Equation from a Log Graph - YouTube YouTube Start of suggested clip End of suggested clip So that's nice and what we can do to figure out the base number is substitute. One of these pointsMoreSo that's nice and what we can do to figure out the base number is substitute. One of these points and for x and y to find the base. Let's. Look at this one this is the x-intercept. This is one zero.

1:12 3:30 How to plot log function in matlab - YouTube YouTube Start of suggested clip End of suggested clip And I'm going to plot. Lover. Save your code. And run. So here's a graph of our almost every systemMoreAnd I'm going to plot. Lover. Save your code. And run. So here's a graph of our almost every system in existence. Here you can see from I'm going to show you by highlighting.

The logarithmic function, y=logb(x) , can be shifted k units vertically and h units horizontally with the equation y=logb(x+h)+k . If k>0 , the graph would be shifted upwards. If k<0 , the graph would be shifted downwards. If h>0 , the graph would be shifted left.

Creating a Log Log Chart in Excel Select the data that you want to plot. Click the Insert tab, and then click Scatter. Click Scatter with only Markers. Click OK. Right-click the x-axis, and then click Format Axis. Under Axis Type, click Logarithmic scale. Click OK. Right-click the y-axis, and then click Format Axis.

Get This Form Now!

Use professional pre-built templates to fill in and sign documents online faster. Get access to thousands of forms.
Get form
If you believe that this page should be taken down, please follow our DMCA take down processhere.

Industry-leading security and compliance

US Legal Forms protects your data by complying with industry-specific security standards.
  • In businnes since 1997
    25+ years providing professional legal documents.
  • Accredited business
    Guarantees that a business meets BBB accreditation standards in the US and Canada.
  • Secured by Braintree
    Validated Level 1 PCI DSS compliant payment gateway that accepts most major credit and debit card brands from across the globe.
Get Sample Blood Fridge Maintenance Record Form Template (pdf)
Get form
Form Packages
Adoption
Bankruptcy
Contractors
Divorce
Home Sales
Employment
Identity Theft
Incorporation
Landlord Tenant
Living Trust
Name Change
Personal Planning
Small Business
Wills & Estates
Packages A-Z
Form Categories
Affidavits
Bankruptcy
Bill of Sale
Corporate - LLC
Divorce
Employment
Identity Theft
Internet Technology
Landlord Tenant
Living Wills
Name Change
Power of Attorney
Real Estate
Small Estates
Wills
All Forms
Forms A-Z
Form Library
Customer Service
Terms of Service
Privacy Notice
Legal Hub
Content Takedown Policy
Bug Bounty Program
About Us
Help Portal
Legal Resources
Blog
Affiliates
Contact Us
Delete My Account
Site Map
Industries
Forms in Spanish
Localized Forms
State-specific Forms
Forms Kit
Legal Guides
Real Estate Handbook
All Guides
Prepared for You
Notarize
Incorporation services
Our Customers
For Consumers
For Small Business
For Attorneys
Our Sites
US Legal Forms
USLegal
FormsPass
pdfFiller
signNow
airSlate WorkFlow
DocHub
Instapage
Social Media
Call us now toll free:
+1 833 426 79 33
As seen in:
  • USA Today logo picture
  • CBC News logo picture
  • LA Times logo picture
  • The Washington Post logo picture
  • AP logo picture
  • Forbes logo picture
© Copyright 1997-2025
airSlate Legal Forms, Inc.
3720 Flowood Dr, Flowood, Mississippi 39232