We use cookies to improve security, personalize the user experience, enhance our marketing activities (including cooperating with our marketing partners) and for other business use.
Click "here" to read our Cookie Policy. By clicking "Accept" you agree to the use of cookies. Read less
Read more
Accept
Loading
Form preview
  • US Legal Forms
  • Form Library
  • More Forms
  • More Uncategorized Forms
  • Preparing Control Charts For Performance Graded Asphalt Binders - Ftp Dot State Tx

Get Preparing Control Charts For Performance Graded Asphalt Binders - Ftp Dot State Tx

PREPARING CONTROL CHARTS FOR PERFORMANCE GRADED ASPHALT BINDERS TXDOT DESIGNATION: TEX536C Test Procedure for PREPARING CONTROL CHARTS FOR PERFORMANCE GRADED ASPHALT BINDERS Texas Department of Transportation.

How it works

  1. Open form

    Open form follow the instructions

  2. Easily sign form

    Easily sign the form with your finger

  3. Share form

    Send filled & signed form or save

How to fill out the Preparing Control Charts For Performance Graded Asphalt Binders - Ftp Dot State Tx online

Filling out the Preparing Control Charts For Performance Graded Asphalt Binders form is essential for tracking and graphically displaying test results of asphalt binders. This guide provides clear, step-by-step instructions to help you complete the form accurately and efficiently.

Follow the steps to complete the form successfully:

  1. Click ‘Get Form’ button to obtain the form and open it in the editor.
  2. Begin by completing the project identification and any other required heading information lines at the top of the form.
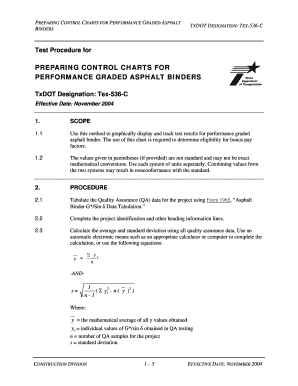
  3. Tabulate your Quality Assurance (QA) data for the project using Form 1965. Ensure that you include all relevant G*/sin δ values obtained during QA testing.
  4. Calculate the average (y) and standard deviation (s) of all QA data. You can utilize an automatic electronic method or follow the specified equations provided in the document.
  5. On the y-axis of your control chart, locate and label the value of 2.20, drawing a horizontal line across the graph and designating it as the Specification Limit.
  6. Identify corresponding points on the y-axis at y, y + s, y + 2s, y + 3s, y - s, y - 2s, and y - 3s and draw horizontal lines across the graph.
  7. Label the lines you drew in the previous step as Mean, Upper Control Limit (UCL), and Lower Control Limit (LCL) as applicable.
  8. Designate the various zones on the control chart: Zone C between y and y ± s, Zone B between y ± s and y ± 2s, and Zone A between y ± 2s and y ± 3s.
  9. Indicate each data point below the x-axis with the sample identification and the numeric value of G*/sin δ.
  10. Plot each QA data point on the Statistical Process Control (SPC) Chart above their corresponding sample identifications using a dot symbol.
  11. Similarly, identify and plot any Verification data points using an 'x' symbol above their sample identifications.
  12. Ensure that you complete and save all required forms. You can download, print, or share the completed form as needed.

Complete your documents online today to streamline your digital document management process.

Get form

Experience a faster way to fill out and sign forms on the web. Access the most extensive library of templates available.
Get form

Related content

preparing control charts for performance graded...
asphalt binder. The use of this chart is required to determine eligibility for bonus pay...
Learn more
Further Development for Binder Quality Assurance...
May 1, 2007 — Form DOT F 1700.7 (8-72) ... 2.3.2 Review of Asphalt Binder Quality...
Learn more
U.S. Government Publishing Office Style Manual...
The Manual is prepared by the GPO Style Board, composed of proofreading, printing,...
Learn more

Related links form

Dole Downloadable Forms Declaration Of Conformity Nitrile Protective Glove BERNER Manu N Introduction Of Customer Satisfaction Patriot America - Travel Health Insurance For Non-US Citizens Traveling To USA And Other Countries

Questions & Answers

Get answers to your most pressing questions about US Legal Forms API.

Contact support

WHAT IS PG SYSTEM? Performance grading is based on the idea that asphalt binder properties should be related to the conditions under which it is used. PG asphalt binders are selected to meet expected climatic conditions as well as aging considerations with a certain level of reliability.

In statistics, Control charts are the tools in control processes to determine whether a manufacturing process or a business process is in a controlled statistical state. This chart is a graph which is used to study process changes over time. These charts are also known as Shewhart charts or process-behavior charts.

Two of the most popular SPC tools are the run chart and the control chart. Both can be produced with the 'AQuA SPC tool' to analyse data that is observed over a period of time. These are called 'dynamic processes'. Charts showing this type of data are often referred to as a 'time-series' or a 'longitudinal' SPC chart.

If in doubt, use an I chart – although this is the least powerful of the charts for detecting special cause. Don't create an SPC chart with fewer than 12 data points (20 for an I chart) – use a run chart instead. Also consider the control limits temporary until you have more than 20 data points.

How to Implement SPC Charts? Step 1: Determine an Appropriate Measurement Method. ... Step 2: Determine the Time Period for Collecting and Plotting Data. ... Step 3: Establish Control Units. ... Step 4: Plot Data Points and Identify Out-Of-Control Data Points. ... Step 5: Correct Out-Of-Control Data Points. ... Step 6: Calculate Cp and Cpk.

One of the most widely used control charts for variable data is the X-bar and R chart. X-bar represents the average or “mean” value of the variable x. The X-bar chart displays the variation in the sample means or averages. The Range chart shows the variation within the subgroup.

How to Implement SPC Charts? Step 1: Determine an Appropriate Measurement Method. ... Step 2: Determine the Time Period for Collecting and Plotting Data. ... Step 3: Establish Control Units. ... Step 4: Plot Data Points and Identify Out-Of-Control Data Points. ... Step 5: Correct Out-Of-Control Data Points. ... Step 6: Calculate Cp and Cpk.

PG grading uses various measurements of the binder's flow properties to establish its grade, which is expressed as two numbers. For example, in "PG 64-22," the "64" represents the maximum pavement temperature, in degrees Celsius, for which this binder can be used with low traffic levels.

Get This Form Now!

Use professional pre-built templates to fill in and sign documents online faster. Get access to thousands of forms.
Get form
If you believe that this page should be taken down, please follow our DMCA take down processhere.

Industry-leading security and compliance

US Legal Forms protects your data by complying with industry-specific security standards.
  • In businnes since 1997
    25+ years providing professional legal documents.
  • Accredited business
    Guarantees that a business meets BBB accreditation standards in the US and Canada.
  • Secured by Braintree
    Validated Level 1 PCI DSS compliant payment gateway that accepts most major credit and debit card brands from across the globe.
Get Preparing Control Charts For Performance Graded Asphalt Binders - Ftp Dot State Tx
Get form
Form Packages
Adoption
Bankruptcy
Contractors
Divorce
Home Sales
Employment
Identity Theft
Incorporation
Landlord Tenant
Living Trust
Name Change
Personal Planning
Small Business
Wills & Estates
Packages A-Z
Form Categories
Affidavits
Bankruptcy
Bill of Sale
Corporate - LLC
Divorce
Employment
Identity Theft
Internet Technology
Landlord Tenant
Living Wills
Name Change
Power of Attorney
Real Estate
Small Estates
Wills
All Forms
Forms A-Z
Form Library
Customer Service
Terms of Service
Privacy Notice
Legal Hub
Content Takedown Policy
Bug Bounty Program
About Us
Blog
Affiliates
Contact Us
Delete My Account
Site Map
Industries
Forms in Spanish
Localized Forms
State-specific Forms
Forms Kit
Legal Guides
Real Estate Handbook
All Guides
Prepared for You
Notarize
Incorporation services
Our Customers
For Consumers
For Small Business
For Attorneys
Our Sites
US Legal Forms
USLegal
FormsPass
pdfFiller
signNow
airSlate WorkFlow
DocHub
Instapage
Social Media
Call us now toll free:
+1 833 426 79 33
As seen in:
  • USA Today logo picture
  • CBC News logo picture
  • LA Times logo picture
  • The Washington Post logo picture
  • AP logo picture
  • Forbes logo picture
© Copyright 1997-2025
airSlate Legal Forms, Inc.
3720 Flowood Dr, Flowood, Mississippi 39232