Get Grade 7 Data Management Test
How it works
-

Open form follow the instructions
-

Easily sign the form with your finger
-

Send filled & signed form or save
How to fill out the Grade 7 Data Management Test online
Completing the Grade 7 Data Management Test online can be a straightforward process if you follow the right steps. This guide provides clear and comprehensive instructions on how to effectively fill out the test components based on your data management skills.
Follow the steps to complete the Grade 7 Data Management Test online.
- Press the ‘Get Form’ button to access the Grade 7 Data Management Test and open it in your preferred platform.
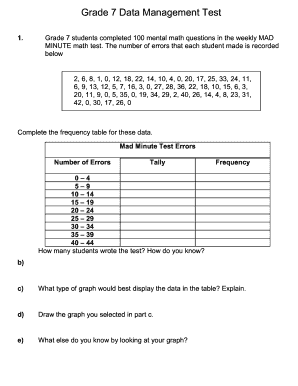
- Begin by reviewing the mental math results provided. Take note of the number of errors recorded for each student and prepare to complete the frequency table.
- Fill in each category in the frequency table for the number of errors made. Count how many students fall into each range (0-4, 5-9, etc.) and input this data accordingly.
- Determine the total number of students who took the test. Ensure your calculations are accurate by summing the frequencies from your completed table.
- Select the appropriate type of graph to represent your data visually. Consider factors like clarity and ease of understanding when making your choice.
- Draw the chosen graph based on the data in your frequency table. Make sure your graph accurately reflects the information presented.
- Reflect on your graph. Describe any insights you gather from the visual representation of the data.
- Proceed to the second section regarding fitness challenge scores. Begin by creating a stem-and-leaf plot for the jumping jacks results.
- Title your stem-and-leaf plot appropriately. Ensure it relates directly to the data being presented.
- Calculate the range, median, and mode of the fitness scores, providing clear explanations for your findings.
- Analyze which measure of central tendency best represents the scores. Justify your choice thoughtfully.
- In the next section on yearly sales of lamps, identify suitable graph types for the sales data. Decide which graph conveys the growth trend effectively.
- Draw your selected graph, ensuring it illustrates the dramatic increase in sales accurately. Explain how the visual aids understanding.
- Predict future sales based on your graph. Provide an explanation of your prediction methodology.
- Review and calculate the necessary scores needed for the final student's 8th test to meet the average, mode, and median requirements.
- Finally, examine the survey questions regarding biases. Rewrite questions to minimize bias and identify whether primary or secondary data is being collected in each scenario.
Start completing the Grade 7 Data Management Test online to enhance your data management skills!
While data management at grade 12 serves advanced concepts, its foundational principles are beneficial at the Grade 7 Data Management Test level as well. Reviewing grade 12 materials can deepen understanding and prepare students for future studies. It is crucial to connect earlier knowledge to higher concepts, ensuring a smoother transition for learners. Ultimately, every level of data management contributes to a robust educational experience.
Industry-leading security and compliance
-
In businnes since 199725+ years providing professional legal documents.
-
Accredited businessGuarantees that a business meets BBB accreditation standards in the US and Canada.
-
Secured by BraintreeValidated Level 1 PCI DSS compliant payment gateway that accepts most major credit and debit card brands from across the globe.