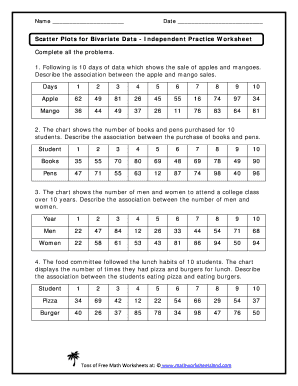
Name Date Scatter Plots for Bivariate Data Independent Practice Worksheet Complete all the problems. 1. Following is 10 days of data which shows the sale of apples and mangoes. Describe the association.

How it works
  • Open form

    Open form follow the instructions

  • Easily sign form

    Easily sign the form with your finger

  • Share form

    Send filled & signed form or save

How to fill out the Bivariate Data Worksheets Pdf online

Completing the Bivariate Data Worksheets Pdf online can streamline your data analysis process. This guide provides clear instructions to help you navigate each section of the form efficiently.

Follow the steps to fill out the Bivariate Data Worksheets Pdf online.

  1. Click ‘Get Form’ button to obtain the form and access it in your preferred online editor.
  2. Begin with the first section where you enter your name and the date. These fields help identify your completed worksheet.
  3. Proceed to the various data charts provided. For each dataset, such as Apple and Mango sales, closely examine the provided data for correctness.
  4. In each specific problem section, describe the association as instructed. This will involve analyzing the correlation between the two variables presented in each chart.
  5. Continue through each exercise, making sure to complete all the problems listed, providing clear and concise descriptions of the data associations.
  6. Once you have finished all sections, review the entire document for any errors or missing entries.
  7. Finally, save your changes, download the completed form, or print it for your records.

Start filling out your Bivariate Data Worksheets Pdf online today to enhance your data analysis skills.

Get form

Experience a faster way to fill out and sign forms on the web. Access the most extensive library of templates available.

Related content

Walking and Bicycling To Work (Teacher Version)...

Students will be able to interpret two-way tables containing data on two categorical...

Learn more
Bivariate data

This lesson fits within the topic of Statistics and focuses on bivariate data. Students...

Learn more
Mastering the hp 39g+

This booklet is intended to help you to master your hp 39g+ calculator but is also aimed...

Learn more
Questions & Answers

Get answers to your most pressing questions about US Legal Forms API.

Contact support

What model do you use to analyze your bivariate data?

Graphical methods Graphs that are appropriate for bivariate analysis depend on the type of variable. For two continuous variables, a scatterplot is a common graph. When one variable is categorical and the other continuous, a box plot is common and when both are categorical a mosaic plot is common.

Types of Bivariate Analysis If the independent variable is categorical, like a particular brand of pen, then logit or probit regression can be used. If independent and dependent both the attributes are ordinal, which means they have position or ranking, then we can measure a rank correlation coefficient.

Simple bivariate correlation is a statistical technique that is used to determine the existence of relationships between two different variables (i.e., X and Y). It shows how much X will change when there is a change in Y.

More specifically, bivariate analysis explores how the dependent ("outcome") variable depends or is explained by the independent ("explanatory") variable (asymmetrical analysis), or it explores the association between two variables without any cause and effect relationship (symmetrical analysis).

The most common method of visualizing the relationship between two continuous variables is by using a scatterplot.

Data for two variables (usually two types of related data). Example: Ice cream sales versus the temperature on that day. The two variables are Ice Cream Sales and Temperature.

Bivariate analysis is one of the statistical analysis where two variables are observed. One variable here is dependent while the other is independent. These variables are usually denoted by X and Y. So, here we analyse the changes occured between the two variables and to what extent.

Bivariate data is most often displayed using a scatter plot. This is a plot on a grid paper of y (y-axis) against x (x-axis) and indicates the behavior of given data sets. Scatter plot is one of the popular types of graphs that give us a much more clear picture of a possible relationship between the variables.

Get This Form Now!

Use professional pre-built templates to fill in and sign documents online faster. Get access to thousands of forms.

If you believe that this page should be taken down, please follow our DMCA take down process here.

Get Bivariate Data Worksheets Pdf