We use cookies to improve security, personalize the user experience, enhance our marketing activities (including cooperating with our marketing partners) and for other business use.
Click "here" to read our Cookie Policy. By clicking "Accept" you agree to the use of cookies. Read less
Read more
Accept
Loading
Form preview
  • US Legal Forms
  • Form Library
  • More Forms
  • More Multi-State Forms
  • Gcse Exam Questions On Box Plots & Iqr (grade B)

Get Gcse Exam Questions On Box Plots & Iqr (grade B)

GCSE Exam Questions on Box Plots & IQR (Grade B) 1. The times, in seconds, taken by 11 teachers to solve a puzzle are listed in order 4 (a) 12 13 17 18 20 22 24 25 30 34 Find (i) the lower quartile,.

How it works

  1. Open form

    Open form follow the instructions

  2. Easily sign form

    Easily sign the form with your finger

  3. Share form

    Send filled & signed form or save

How to fill out the GCSE Exam Questions on Box Plots & IQR (Grade B) online

This guide provides clear and supportive instructions on filling out the GCSE exam questions related to box plots and interquartile range (IQR). Following these steps will help you navigate the process efficiently and effectively.

Follow the steps to successfully complete the exam questions online.

  1. Click ‘Get Form’ button to obtain the document and open it in your preferred online editing tool.
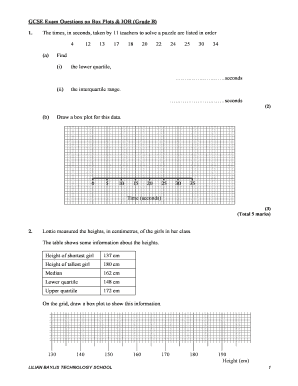
  2. Read through the first question carefully. You will find a list of times taken by teachers to solve a puzzle. Begin by determining the lower quartile and the interquartile range by calculating the relevant values based on the provided list.
  3. For the next part of the question, you will need to draw a box plot based on the data provided. Be sure to include the minimum, lower quartile, median, upper quartile, and maximum values.
  4. Upon completing all sections, save your changes. You can choose to download, print, or share the filled-out form as needed.

Complete your GCSE exam questions online now to assess your understanding of box plots and IQR.

Get form

Experience a faster way to fill out and sign forms on the web. Access the most extensive library of templates available.
Get form

Related content

THE EFFICACY OF INTERVENTIONS ON PUPIL ... - ERIC
holiday classes and a past paper programme. ... GCSE Maths; Educational interventions;...
Learn more
Activity 10 Cumulative Frequency Teacher S Notes
notes, Quartiles and interquartile range, Work 2 on histograms and box and whisker...
Learn more
Statistics - Wikipedia
Scatter plots are used in descriptive statistics to show the observed relationships...
Learn more

Related links form

YouthChildren39s Ministry Volunteer Form - SNEC YouthYoung Adults - Snecyouth (FMLA) Request Form - Ellwood City Area School District - Ellwood Oasystems Anfrageformular Januar 2016 Vorschlag - Elsental Movement Of Crustal Plates Diagram

Questions & Answers

Get answers to your most pressing questions about US Legal Forms API.

Contact support

To draw a box plot accurately, start by ordering your data from smallest to largest. Calculate the five key values: minimum, Q1, median, Q3, and maximum. Plot these values on a number line and create the box from Q1 to Q3, with lines extending to the minimum and maximum. This skill will serve you well in answering GCSE Exam Questions On Box Plots & IQR (Grade B) effectively.

The five elements of a box plot include the minimum value, Q1, median, Q3, and maximum value. These components provide a comprehensive overview of data distribution. Familiarizing yourself with these terms will empower you to answer GCSE Exam Questions On Box Plots & IQR (Grade B) with precision and clarity.

Drawing box plots for your GCSE requires a systematic approach. Begin by determining the minimum, Q1, median, Q3, and maximum values of your dataset. Once you have these, place them on a number line and construct a box from Q1 to Q3, drawing lines to the minimum and maximum. This skill is critical for success in GCSE Exam Questions On Box Plots & IQR (Grade B).

To find 75% on a box plot, also known as the third quartile (Q3), locate the upper boundary of the box. This line represents the data point where 75% of the values fall below it. Understanding the concept of Q3 is essential for tackling GCSE Exam Questions On Box Plots & IQR (Grade B). By practicing problems, you can gain confidence in reading box plots effectively.

To find the IQR in a box plot, first identify the box, noting the positions of Q1 and Q3. The IQR is calculated by subtracting Q1 from Q3. This range gives a clear picture of the data dispersion. Utilizing resources like USLegalForms can provide practical exercises related to GCSE exam questions on box plots & IQR (Grade B), helping you to apply this knowledge.

The 1.5 IQR rule is a guideline to identify outliers in your data. According to this rule, any data point that lies beyond Q1 - 1.5 IQR or Q3 + 1.5 IQR is considered an outlier. This method assists in understanding extreme values in your dataset, promoting effective data analysis. Practicing GCSE exam questions on box plots & IQR (Grade B) will aid in mastering this rule and its applications.

Finding IQR using a graph involves locating the first and third quartiles on the plot. Measure the distance between the Q1 and Q3 markers; this difference represents the IQR. Visualizing this on a graph allows you to easily see the spread of the middle 50% of data points. Engaging with GCSE exam questions on box plots & IQR (Grade B) will help solidify this concept.

To find the IQR on a box plot, look at the lengths of the box formed by Q1 and Q3. The IQR is the distance between these two points on the horizontal axis. Make sure to visualize and comprehend what this range indicates about your data. By practicing GCSE exam questions on box plots & IQR (Grade B), you will become more proficient in identifying IQR from box plots.

To find Q1 and Q3 in a box plot, first locate the box in the plot. The left edge of the box represents Q1, while the right edge represents Q3. Use the data set to identify the values at these positions, ensuring you have accurately calculated them from the ordered list. Understanding how to interpret GCSE exam questions on box plots & IQR (Grade B) is key to mastering this topic.

Calculating the interquartile range (IQR) for GCSE requires you to first find Q1 and Q3 from your data set. The IQR is the difference between Q3 and Q1. This measurement gives insight into the variability of your data set, highlighting the middle 50% of values. Engaging with GCSE exam questions on box plots & IQR (Grade B) can strengthen your skills in this area.

Get This Form Now!

Use professional pre-built templates to fill in and sign documents online faster. Get access to thousands of forms.
Get form
If you believe that this page should be taken down, please follow our DMCA take down processhere.

Industry-leading security and compliance

US Legal Forms protects your data by complying with industry-specific security standards.
  • In businnes since 1997
    25+ years providing professional legal documents.
  • Accredited business
    Guarantees that a business meets BBB accreditation standards in the US and Canada.
  • Secured by Braintree
    Validated Level 1 PCI DSS compliant payment gateway that accepts most major credit and debit card brands from across the globe.
Get GCSE Exam Questions On Box Plots & IQR (Grade B)
Get form
Form Packages
Adoption
Bankruptcy
Contractors
Divorce
Home Sales
Employment
Identity Theft
Incorporation
Landlord Tenant
Living Trust
Name Change
Personal Planning
Small Business
Wills & Estates
Packages A-Z
Form Categories
Affidavits
Bankruptcy
Bill of Sale
Corporate - LLC
Divorce
Employment
Identity Theft
Internet Technology
Landlord Tenant
Living Wills
Name Change
Power of Attorney
Real Estate
Small Estates
Wills
All Forms
Forms A-Z
Form Library
Customer Service
Terms of Service
Privacy Notice
Legal Hub
Content Takedown Policy
Bug Bounty Program
About Us
Blog
Affiliates
Contact Us
Delete My Account
Site Map
Industries
Forms in Spanish
Localized Forms
State-specific Forms
Forms Kit
Legal Guides
Real Estate Handbook
All Guides
Prepared for You
Notarize
Incorporation services
Our Customers
For Consumers
For Small Business
For Attorneys
Our Sites
US Legal Forms
USLegal
FormsPass
pdfFiller
signNow
airSlate WorkFlow
DocHub
Instapage
Social Media
Call us now toll free:
+1 833 426 79 33
As seen in:
  • USA Today logo picture
  • CBC News logo picture
  • LA Times logo picture
  • The Washington Post logo picture
  • AP logo picture
  • Forbes logo picture
© Copyright 1997-2025
airSlate Legal Forms, Inc.
3720 Flowood Dr, Flowood, Mississippi 39232