Get Creating Tables And Graphs Of Ratios 2020-2025
How it works
-

Open form follow the instructions
-

Easily sign the form with your finger
-

Send filled & signed form or save
How to fill out the Creating Tables And Graphs Of Ratios online
Filling out the Creating Tables And Graphs Of Ratios form is a straightforward process that helps users understand mathematical ratios through tabular data and graphical representation. This guide will provide a step-by-step approach to ensure your completion of the form is efficient and effective.
Follow the steps to successfully complete the form online.
- Press the ‘Get Form’ button to access the form and open it in your preferred online editing tool.
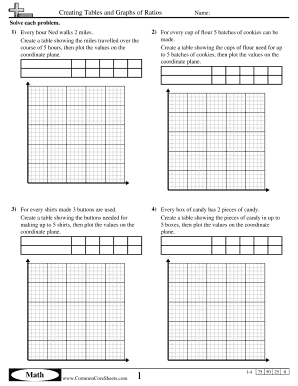
- Read the first problem carefully, which states that every hour, Ned walks 2 miles. Create a table where you will list the hours (from 1 to 5) in one column and corresponding distances (in miles) in the adjacent column. Fill in the table as follows: for hour 1, enter 2 miles, hour 2, enter 4 miles, hour 3, enter 6 miles, hour 4, enter 8 miles, and hour 5, enter 10 miles.
- Next, plot the values from your table on a coordinate plane. The x-axis will represent the number of hours, and the y-axis will represent the distance in miles.
- Move to the second problem. Here, for every cup of flour, 5 batches of cookies can be produced. Create a new table showing various cups of flour (from 1 to 5) and their corresponding number of batches of cookies. For cup 1, list 5 batches, cup 2, list 10 batches, and so on until cup 5.
- Again, plot these values on the coordinate plane, with the x-axis representing the cups of flour and the y-axis showing the number of batches of cookies.
- Proceed to the third problem where it mentions that for every shirt made, 3 buttons are required. Create a table similar to previous steps showing the number of shirts (from 1 to 5) alongside the buttons used (3 for shirt 1, 6 for shirt 2, continuing to 15 for shirt 5).
- Plot these results on the coordinate plane where x-axis represents shirts made and the y-axis represents buttons.
- Finally, for the last problem regarding boxes of candy, create a table that reflects the number of boxes (from 1 to 5) and the number of candy pieces. Each box contains 2 pieces of candy, so fill in the respective values accordingly.
- Plot the data points on a coordinate plane with the number of boxes on the x-axis and pieces of candy on the y-axis.
- After you have filled in all parts of the form, ensure to save your progress. You can download, print, or share the completed form as needed.
Begin filling out the Creating Tables And Graphs Of Ratios form online today!
To fill in missing values for a table with equivalent ratios, focus on the known ratios and establish a pattern. Use multiplication or division to find unknown values that maintain the same ratio. For example, if you have a known ratio of , and need to find a missing value, ensure that any numbers you calculate still reflect this ratio accurately. Using a systematic approach, supported by tools like those from UsLegalForms, simplifies this process.
Industry-leading security and compliance
-
In businnes since 199725+ years providing professional legal documents.
-
Accredited businessGuarantees that a business meets BBB accreditation standards in the US and Canada.
-
Secured by BraintreeValidated Level 1 PCI DSS compliant payment gateway that accepts most major credit and debit card brands from across the globe.