Loading
Get Linear Regression Worksheet 1 Rpdp Answer Key 2020-2026
How it works
-

Open form follow the instructions
-

Easily sign the form with your finger
-

Send filled & signed form or save
How to fill out the Linear Regression Worksheet 1 Rpdp Answer Key online
This guide provides users with clear and concise instructions on how to complete the Linear Regression Worksheet 1 Rpdp Answer Key online. Whether you are familiar with linear regression or new to the concept, this step-by-step approach will assist you in accurately filling out the worksheet.
Follow the steps to successfully complete the worksheet.
- Click ‘Get Form’ button to obtain the form and access it within your preferred online editor.
- Begin by entering your name, date, and period in the designated fields. Ensure that all information is accurate and legible.
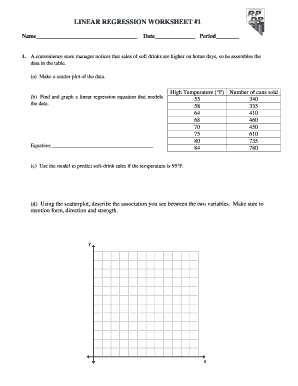
- Proceed to the first question pertaining to the convenience store manager's observation. Create a scatter plot using the given data on high temperatures and cans sold. Use graphing tools available in the online editor to accurately represent this information visually.
- Next, you will need to derive the linear regression equation that models the data from the first question. Input the equation in the designated field provided for this purpose.
- To predict soft drink sales at 95°F, utilize the established linear regression equation. Calculate the expected sales and record your findings in the appropriate section.
- Analyze the scatter plot created earlier. Describe the association between temperature and sales, emphasizing the form, direction, and strength of the correlation. This should be detailed in the provided text area.
- Move on to the second question, starting with the data related to femur length and height. Repeat the scatter plot creation for this data.
- Establish the linear regression equation for the femur length and height data and enter it in the appropriate area.
- When given a femur length of 58 cm, apply the linear regression equation to predict the associated height, and input this result in the designated field.
- Lastly, describe the association seen in the scatter plot for the femur length and height data, including its form, direction, and strength. This response should be inserted in the specified text area.
- After completing all sections, review your responses for accuracy. Once satisfied, you can save changes, download or print the worksheet, or share it as needed.
Complete your Linear Regression Worksheet online today to enhance your understanding of these concepts.