Loading
Get Rain Chart 2020 2020-2026
How it works
-

Open form follow the instructions
-

Easily sign the form with your finger
-

Send filled & signed form or save
How to fill out the Rain Chart 2020 online
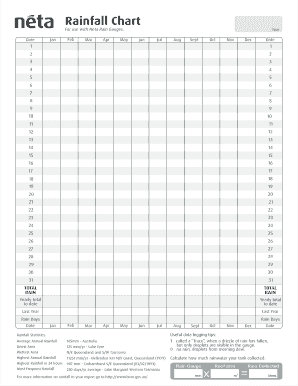
The Rain Chart 2020 is a vital tool for tracking rainfall data over the year. This guide will assist users in filling out the form online, ensuring accurate data logging for their Neta Rain Gauges.
Follow the steps to accurately complete the Rain Chart 2020
- Click the ‘Get Form’ button to obtain the form and open it in the editor.
- Begin by entering the 'Date' for each entry, specifying the first date in the designated section. Make sure to align the dates with the corresponding month.
- Fill in each month’s rainfall measurements in the appropriate boxes for 'Jan' through 'Dec.' Record the daily rainfall data as accurately as possible.
- At the bottom of each month, calculate and enter the 'Total Rain' by summing up the daily totals for that month.
- Complete the 'Yearly total to date' by adding the totals from each month to provide a cumulative total for the year.
- Record 'Rain Days' by noting the number of days that received measurable rain. This helps track rainfall frequency.
- Finally, save your changes, then download, print, or share the completed form as needed.
Start completing your Rain Chart 2020 online today to maintain accurate rainfall records.
One centimeter of rainfall signifies that one liter of water falls on one square meter of ground. This measurement is often presented in a rain chart 2020, helping you visualize the depth of rain over time. Understanding this concept is crucial for farmers and gardeners who rely on this data for irrigation planning. Monitoring rainfall data in centimeters aids in effective water management.