We use cookies to improve security, personalize the user experience, enhance our marketing activities (including cooperating with our marketing partners) and for other business use.
Click "here" to read our Cookie Policy. By clicking "Accept" you agree to the use of cookies. Read less
Read more
Accept
Loading
Form preview
  • US Legal Forms
  • Form Library
  • More Forms
  • More Multi-State Forms
  • Solubility Graph Worksheet 2020

Get Solubility Graph Worksheet 2020-2025

How it works

  1. Open form

    Open form follow the instructions

  2. Easily sign form

    Easily sign the form with your finger

  3. Share form

    Send filled & signed form or save

How to fill out the Solubility Graph Worksheet online

The Solubility Graph Worksheet is an essential tool for understanding the relationship between solubility and temperature for various solutes. This guide will provide you with step-by-step instructions on how to accurately complete the worksheet online.

Follow the steps to successfully complete the Solubility Graph Worksheet.

  1. Click ‘Get Form’ button to obtain the Solubility Graph Worksheet and open it in your online editor.
  2. Begin with the name field at the top of the worksheet. Clearly write your name in the designated space to identify your submission.
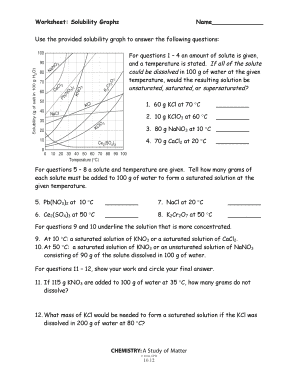
  3. For questions 1-4, review the amount of solute and temperature provided for each item. Indicate whether the solution would be unsaturated, saturated, or supersaturated in the blank spaces provided.
  4. In questions 5-8, identify the amount of solute needed to create a saturated solution at the given temperatures. Record your answers in the specified blanks.
  5. For questions 9 and 10, underline the solution that is more concentrated based on the information given in the question.
  6. In questions 11-12, show your work for calculations. Circle your final answers to highlight them clearly.
  7. Once all fields are completed, review your answers for accuracy. Make any necessary edits.
  8. Save your changes, then download, print, or share the completed worksheet as needed.

Start completing your Solubility Graph Worksheet online now!

Get form

Experience a faster way to fill out and sign forms on the web. Access the most extensive library of templates available.
Get form

Related content

Solutions, Acids, and Bases - South Carolina...
Solubility Curve Worksheet: This worksheet provides a solubility curve with questions for...
Learn more
[PDF] Solubility Worksheet #2 Level 2
Use the data table to construct a line graph. Remember to set up your axes and label...
Learn more
In-situ Chemical Oxidation Design Tool
Step 2: Click the calculate button at the bottom of "Site Data Input" Worksheet....
Learn more

Related links form

OBSOLETE PUBLICATIONS AND FORMS - Hood Army COMMERCIAL RENTAL APPLICATION - Rcg-llc.com Washington Practitioner Application Authorization And Release Of Information Form Printable 990 N Form

Questions & Answers

Get answers to your most pressing questions about US Legal Forms API.

Contact support

Conducting a solubility experiment involves mixing a known quantity of solute with a specific volume of solvent until no more solute dissolves. You can then take measurements to determine the solubility. It’s effective to record your data on a Solubility Graph Worksheet, which will help you visualize your findings and stay organized.

To determine if the solution is saturated or unsaturated, you need to compare the amount of solute with the solubility at that temperature. If the solubility of NH4Cl at 50°C is greater than 50g per 100 mL, the solution is unsaturated; otherwise, it's saturated. Utilizing a Solubility Graph Worksheet can provide specific solubility values to make this comparison easier.

A solubility chart is a graphical representation that shows how much of a solute can dissolve in a solvent at various temperatures. It provides valuable insights into the solubility properties of different substances, helping you understand how temperature affects solubility. Utilizing a Solubility Graph Worksheet can enhance your understanding by providing a clear reference for these relationships.

Creating solubility charts involves compiling solubility data for various substances at different temperatures. Collect the necessary data, then organize it neatly in a table format before transferring it to a chart. This representation makes it easier to compare solubility trends across different compounds. Use a Solubility Graph Worksheet for a streamlined way to record experiments and create clarity.

To plot a graph of solubility, start by collecting data on how much solute dissolves in a specific amount of solvent at varying temperatures. Next, create a set of axes with the temperature on the x-axis and solubility on the y-axis. You can use this data to plot points and connect them to visualize the solubility trend. Utilize a Solubility Graph Worksheet to effectively organize your data throughout this process.

To create a solubility chart, gather data on a variety of substances, noting their solubility in water at different temperatures. Organize this data into a table where you can easily read and compare it. Using the Solubility Graph Worksheet, you can effectively incorporate your findings and share your insights with others.

To determine solubility, you can conduct a simple laboratory experiment where you gradually add a solute to a solvent until no more dissolves. Measure the amount of solute that has dissolved at a specific temperature to find its solubility. Recording these observations in a Solubility Graph Worksheet will help you keep track of your findings and visualize the results.

Creating a solubility chart involves compiling solubility data for various solutes at different temperatures. List the solutes and their corresponding solubility values in a table format. With this organized information, you can easily compare and analyze solute behavior, and a Solubility Graph Worksheet can assist in presenting this data effectively.

To draw a graph of solubility, collect empirical data regarding the substance's solubility at various temperatures. On graph paper or a digital format, mark the temperature on the horizontal axis and solubility levels on the vertical axis. Connect the data points to reveal trends in solubility changes, and you can use a Solubility Graph Worksheet as a template for accuracy.

The solubility of potassium nitrate in water at 40 degrees Celsius is approximately 38 grams per 100 milliliters. For accurate reporting and further studies, documenting this data in a Solubility Graph Worksheet is highly beneficial. This worksheet can help in visualizing this information alongside other solutes as part of a broader analysis.

Get This Form Now!

Use professional pre-built templates to fill in and sign documents online faster. Get access to thousands of forms.
Get form
If you believe that this page should be taken down, please follow our DMCA take down processhere.

Industry-leading security and compliance

US Legal Forms protects your data by complying with industry-specific security standards.
  • In businnes since 1997
    25+ years providing professional legal documents.
  • Accredited business
    Guarantees that a business meets BBB accreditation standards in the US and Canada.
  • Secured by Braintree
    Validated Level 1 PCI DSS compliant payment gateway that accepts most major credit and debit card brands from across the globe.
Get Solubility Graph Worksheet
Get form
Form Packages
Adoption
Bankruptcy
Contractors
Divorce
Home Sales
Employment
Identity Theft
Incorporation
Landlord Tenant
Living Trust
Name Change
Personal Planning
Small Business
Wills & Estates
Packages A-Z
Form Categories
Affidavits
Bankruptcy
Bill of Sale
Corporate - LLC
Divorce
Employment
Identity Theft
Internet Technology
Landlord Tenant
Living Wills
Name Change
Power of Attorney
Real Estate
Small Estates
Wills
All Forms
Forms A-Z
Form Library
Customer Service
Terms of Service
Privacy Notice
Legal Hub
Content Takedown Policy
Bug Bounty Program
About Us
Blog
Affiliates
Contact Us
Delete My Account
Site Map
Industries
Forms in Spanish
Localized Forms
State-specific Forms
Forms Kit
Legal Guides
Real Estate Handbook
All Guides
Prepared for You
Notarize
Incorporation services
Our Customers
For Consumers
For Small Business
For Attorneys
Our Sites
US Legal Forms
USLegal
FormsPass
pdfFiller
signNow
airSlate WorkFlow
DocHub
Instapage
Social Media
Call us now toll free:
+1 833 426 79 33
As seen in:
  • USA Today logo picture
  • CBC News logo picture
  • LA Times logo picture
  • The Washington Post logo picture
  • AP logo picture
  • Forbes logo picture
© Copyright 1997-2025
airSlate Legal Forms, Inc.
3720 Flowood Dr, Flowood, Mississippi 39232