We use cookies to improve security, personalize the user experience, enhance our marketing activities (including cooperating with our marketing partners) and for other business use.
Click "here" to read our Cookie Policy. By clicking "Accept" you agree to the use of cookies. Read less
Read more
Accept
Loading
Form preview
  • US Legal Forms
  • Form Library
  • More Forms
  • More Multi-State Forms
  • Pressure Temperature Chart 2020

Get Pressure Temperature Chart 2020-2025

How it works

  1. Open form

    Open form follow the instructions

  2. Easily sign form

    Easily sign the form with your finger

  3. Share form

    Send filled & signed form or save

How to fill out the Pressure Temperature Chart online

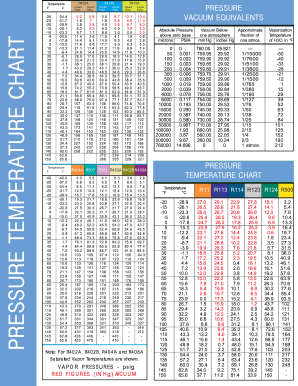
The Pressure Temperature Chart is an essential tool for users in various industries that require accurate temperature and pressure readings. This guide will assist you in filling out the Pressure Temperature Chart online, ensuring that you understand each section clearly.

Follow the steps to successfully complete the Pressure Temperature Chart.

  1. Press the ‘Get Form’ button to access the Pressure Temperature Chart online.
  2. Begin by entering the temperature in Fahrenheit (°F) or Celsius (°C) in the dedicated fields. Ensure that the values match the required data range indicated in the chart.
  3. Next, locate the specified pressure values for the corresponding temperature. Fill in the liquid and vapor pressures as needed based on your measurements.
  4. If applicable, review the saturation data for different refrigerants specified in the chart. Ensure that you select the correct refrigerant type and input the values accurately.
  5. Carefully check each entry for accuracy, confirming that all the data aligns with the pressures and temperatures calculated during your measurements.
  6. Once you have filled out all necessary sections, you can save your changes, download the completed chart, or print it directly from the online form.
  7. Finally, consider sharing the completed Pressure Temperature Chart with relevant stakeholders or partners to ensure collaborative understanding of the data.

Start completing your documents online today for a streamlined experience.

Get form

Experience a faster way to fill out and sign forms on the web. Access the most extensive library of templates available.
Get form

Related content

Common Features of Constant Pressure Charts...
These undulations represent different densities (due to different air temperatures) in the...
Learn more
R32 Pressure Temperature Chart A Gas |...
book r32 pressure temperature chart a gas after that it is not directly done, you could...
Learn more
Steam - Wikipedia
Steam is water in the gas phase. It is commonly formed by boiling or evaporating water...
Learn more

Related links form

Transcript Request Form - Memphis Center For Urban Theological ... - Mcuts Application For Admission - TCAT Hartsville - Tcathartsville Documents Pertaining To The Lairds Of Kincaid 1425 Bb - Kyncades - Kyncades Transcript Request - Chattanooga State Community College - Chattanoogastate

Questions & Answers

Get answers to your most pressing questions about US Legal Forms API.

Contact support

Pressure and temperature are closely related in refrigeration systems; as temperature increases, pressure tends to rise as well. This relationship is vital for understanding the performance of your HVAC system. Regularly consulting your Pressure Temperature Chart can help you maintain this balance, ensuring your systems function effectively.

The R454B Pressure Temperature Chart differs from the R-410A chart in specific pressure and temperature readings. R454B is often used as a lower global warming potential alternative. Comparing these charts will help you understand how each refrigerant performs under similar conditions, ensuring your cooling system is updated appropriately.

The critical pressure of R-410A is around 400 PSI. This value is significant because it represents the pressure at which the refrigerant's liquid and vapor phases become indistinguishable. Understanding this concept can help you better interpret your Pressure Temperature Chart when monitoring your cooling system.

On a typical 70-degree day, your 410A pressure should be approximately 130 PSI. This measurement allows for efficient heat exchange and cooling performance. Always refer to your Pressure Temperature Chart to verify that your system is functioning within the recommended pressure range.

For a 410A system at 70 degrees Fahrenheit, the pressure should ideally fall between 120 to 140 PSI. These readings ensure that the system operates effectively while providing the necessary cooling. Regularly check your Pressure Temperature Chart to maintain these pressure levels.

Signs of an overcharged R-410A system include high pressure readings on your gauges and a decrease in cooling efficiency. You may also notice frost forming on the refrigerant lines. Using a Pressure Temperature Chart allows you to compare current pressures and temperatures, helping you diagnose any issues with your system.

At 70 degrees Fahrenheit, the ideal pressure for an air conditioning system using R-410A typically ranges from 120 to 140 PSI. This pressure is crucial for efficient system operation. Monitoring your Pressure Temperature Chart can help you maintain optimal pressure levels, ensuring your AC runs smoothly.

To calculate the degree of superheat, measure the actual temperature of the refrigerant and find the saturation temperature corresponding to the measured pressure on a pressure-temperature chart. Subtract the saturation temperature from the actual temperature. This degree of superheat indicates how much heat has been added to the refrigerant, which is vital for ensuring system efficiency and performance.

Calculating superheat involves comparing the actual temperature of the refrigerant to its saturation temperature at a given pressure. You can determine the saturation temperature from a pressure-temperature chart based on the measured pressure. Simply subtract the saturation temperature from the actual temperature. This calculation helps maintain optimal performance in HVAC applications.

To find superheat using a pressure-temperature chart, start by measuring the temperature of the refrigerant leaving the evaporator. Next, locate the pressure reading of the refrigerant on the chart and find the corresponding saturation temperature. Finally, subtract that saturation temperature from the actual temperature to obtain the superheat value. This process is crucial for effective HVAC system management.

Get This Form Now!

Use professional pre-built templates to fill in and sign documents online faster. Get access to thousands of forms.
Get form
If you believe that this page should be taken down, please follow our DMCA take down processhere.

Industry-leading security and compliance

US Legal Forms protects your data by complying with industry-specific security standards.
  • In businnes since 1997
    25+ years providing professional legal documents.
  • Accredited business
    Guarantees that a business meets BBB accreditation standards in the US and Canada.
  • Secured by Braintree
    Validated Level 1 PCI DSS compliant payment gateway that accepts most major credit and debit card brands from across the globe.
Get Pressure Temperature Chart
Get form
Form Packages
Adoption
Bankruptcy
Contractors
Divorce
Home Sales
Employment
Identity Theft
Incorporation
Landlord Tenant
Living Trust
Name Change
Personal Planning
Small Business
Wills & Estates
Packages A-Z
Form Categories
Affidavits
Bankruptcy
Bill of Sale
Corporate - LLC
Divorce
Employment
Identity Theft
Internet Technology
Landlord Tenant
Living Wills
Name Change
Power of Attorney
Real Estate
Small Estates
Wills
All Forms
Forms A-Z
Form Library
Customer Service
Terms of Service
Privacy Notice
Legal Hub
Content Takedown Policy
Bug Bounty Program
About Us
Blog
Affiliates
Contact Us
Delete My Account
Site Map
Industries
Forms in Spanish
Localized Forms
State-specific Forms
Forms Kit
Legal Guides
Real Estate Handbook
All Guides
Prepared for You
Notarize
Incorporation services
Our Customers
For Consumers
For Small Business
For Attorneys
Our Sites
US Legal Forms
USLegal
FormsPass
pdfFiller
signNow
airSlate WorkFlow
DocHub
Instapage
Social Media
Call us now toll free:
+1 833 426 79 33
As seen in:
  • USA Today logo picture
  • CBC News logo picture
  • LA Times logo picture
  • The Washington Post logo picture
  • AP logo picture
  • Forbes logo picture
© Copyright 1997-2025
airSlate Legal Forms, Inc.
3720 Flowood Dr, Flowood, Mississippi 39232