Loading
Get Make A Line Graph Speed And Pressure Answers 2020-2025
How it works
-

Open form follow the instructions
-

Easily sign the form with your finger
-

Send filled & signed form or save
How to fill out the Make A Line Graph Speed And Pressure Answers online
This guide provides a comprehensive overview for users on how to effectively fill out the Make A Line Graph Speed And Pressure Answers form online. Whether you are comparing speed and pressure data, this step-by-step instruction will help you complete the process with ease.
Follow the steps to complete the form successfully
- Click ‘Get Form’ button to obtain the form and open it in the editor.
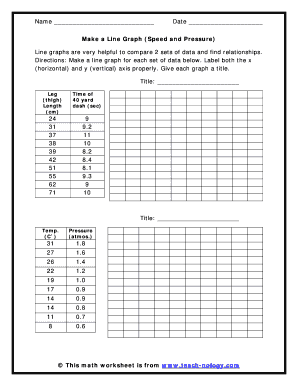
- Begin by identifying the two data sets provided. The first data set involves leg length measurements in centimeters and the corresponding times for a 40-yard dash in seconds. Ensure that you note the units clearly on your graph's axes.
- Create a title for your first graph. This title should reflect the data you are representing — for instance, 'Relationship between Leg Length and 40-Yard Dash Time'.
- Label the x-axis as 'Leg Length (cm)' and the y-axis as 'Time of 40 Yard Dash (sec)'. Make sure both labels are clearly marked.
- Using the provided data, plot the points on the graph according to the values listed for leg length and dash time. Ensure accuracy in point placement.
- Once your first graph is completed, repeat the same procedure for the second data set, which depicts temperature in Celsius against atmospheric pressure in atmospheres.
- Create a relevant title for the second graph, such as 'Relationship between Temperature and Pressure'.
- Label the x-axis as 'Temperature (°C)' and the y-axis as 'Pressure (atmos.)'. Ensure these labels are prominent.
- Plot the points on your second graph using the temperature and pressure data provided, confirming accuracy with each point.
- After completing both graphs, review your work for clarity and correctness before proceeding.
- Lastly, you can save changes to your document, download it for printing, or share it as needed.
Encourage users to complete their documents online for efficient and organized results.
To make a speed graph, gather your speed data and corresponding time measurements. Plot your data points on a line graph, with time on the X-axis and speed on the Y-axis. Connect the points to visualize changes in speed over time. For a more structured approach, uslegalforms has useful resources.
Industry-leading security and compliance
US Legal Forms protects your data by complying with industry-specific security standards.
-
In businnes since 199725+ years providing professional legal documents.
-
Accredited businessGuarantees that a business meets BBB accreditation standards in the US and Canada.
-
Secured by BraintreeValidated Level 1 PCI DSS compliant payment gateway that accepts most major credit and debit card brands from across the globe.