Loading

Open form follow the instructions

Easily sign the form with your finger

Send filled & signed form or save
How to fill out the Regents Biology Lab Graphing Answer Key online
Filling out the Regents Biology Lab Graphing Answer Key is an important step in understanding the development of a human fetus. This guide provides clear instructions and insights into each section of the form to support users in completing it successfully.
Follow the steps to effectively complete the Regents Biology Lab Graphing Answer Key.
- Press the ‘Get Form’ button to access the document and open it for editing.
- Begin by entering your name at the top of the form. Clearly write your first and last name in the designated space.
- For the ‘Period’ section, fill in the current class period you are in with the Regents Biology course.
- In the ‘Date’ section, write today’s date in the format provided on the form.
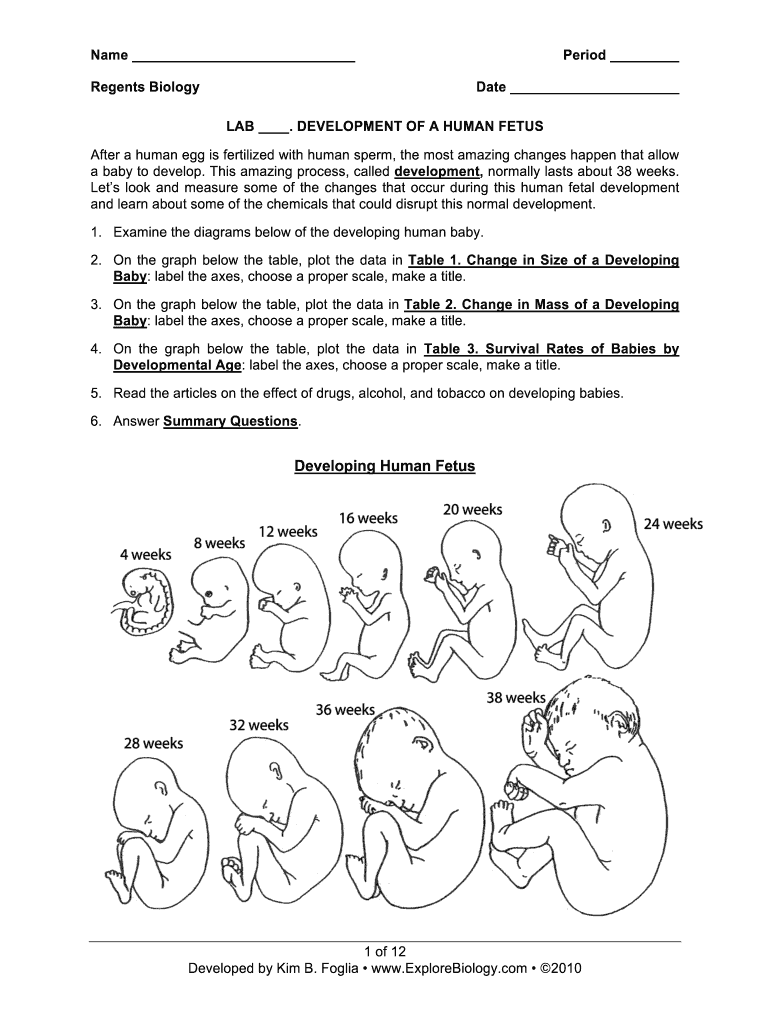
- Locate the section titled ‘Development of a Human Fetus’. Read the introductory information carefully to fully grasp the context of the lab.
- Move to Table 1, where you will be plotting the Change in Size of a Developing Baby. Label the x-axis for time in weeks and the y-axis for length in millimeters. Choose an appropriate scale based on the data provided.
- Proceed to Table 2. Repeat the same plotting procedure for data on Change in Mass of a Developing Baby, labeling axes and selecting your scale effectively.
- In Table 3, plot the Survival Rates of Babies by Developmental Age using relevant data. Ensure you label the axes and choose a proper scale as with the previous tables.
- Read the provided articles regarding the effects of drugs, alcohol, and tobacco on fetal development. This information is crucial for completing the summary questions section.
- Answer all the Summary Questions at the end of the document. Provide clear and detailed responses based on the data and readings presented in the lab.
- Finally, after ensuring all fields are completed accurately, save your changes, and consider downloading, printing, or sharing the completed form for submission.
Complete your Regents Biology Lab Graphing Answer Key online today for a thorough understanding of fetal development!
Experience a faster way to fill out and sign forms on the web. Access the most extensive library of templates available.
Related content
Jun 29, 2025 — Schools must print sufficient copies of the scoring key and rating guide...
Jun 19, 2012 — Follow the procedures below for scoring student answer papers for the...
by S Links — The following chapters summa- rize a decade of monitoring and research...
Get answers to your most pressing questions about US Legal Forms API.
How to make a line graph in biology?
0:22 1:39 Learning About Line Graphs - YouTube YouTube Start of suggested clip End of suggested clip Picture. This makes the data even easier to read in. This line graph it is easy to see that I ateMorePicture. This makes the data even easier to read in. This line graph it is easy to see that I ate the greatest number of apples.
How do you graph in biology?
How to make a graph Identify your independent and dependent variables. Choose the correct type of graph by determining whether each variable is continuous or not. Determine the values that are going to go on the X and Y axis. ... Label the X and Y axis, including units. Graph your data.
What does graphing mean in biology?
Graphing is an important procedure used by scientists to display the data that is collected during a controlled experiment. The most common type of graph used in biology is a line graph.
What are the 4 main parts to a graph biology?
A graph contains five major parts: a title, the independent variable, the dependent variable, the scales for each variable recorded on the axis, and a key to the marks, lines, or different types of data.
What are graphs used for in biology?
Graphs are also used for knowledge representation in the Gene Ontology (GO) [4], and bipartite graphs between biological concepts and scientific papers that are written about them [5] are another form of knowledge representation. A second application of graphs to molecular biology is to model measured data.
Use professional pre-built templates to fill in and sign documents online faster. Get access to thousands of forms.
If you believe that this page should be taken down, please follow our DMCA take down process here.