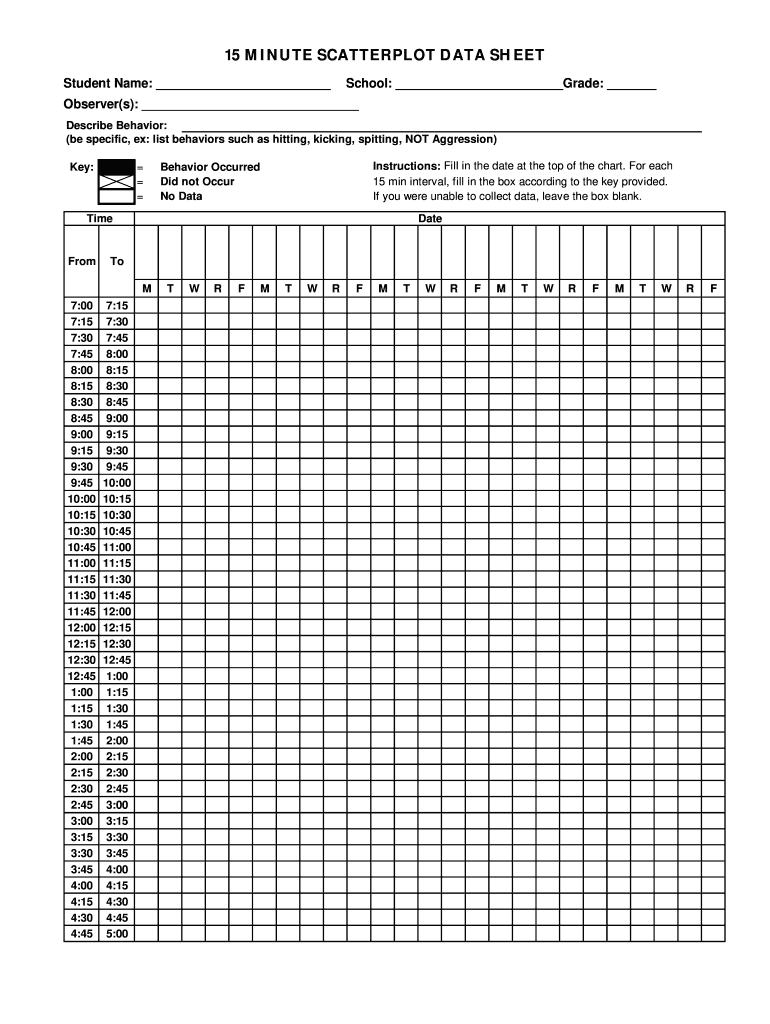
Scribe Behavior: (be specific, ex: list behaviors such as hitting, kicking, spitting, NOT Aggression) Key: Instructions: Fill in the date at the top of the chart. For each 15 min interval, fill in the box according to the key provided. If you were unable to collect data, leave the box blank. Behavior Occurred Did not Occur No Data Time From To 7:00 7:15 7:30 7:45 8:00 8:15 8:30 8:45 9:00 9:15 9:30 9:45 10:00 10:15 10:30 10:45 11:00 11:15 11:30 11:45 12:00 12:15 12:30 12:45 1:00 1:15.

Open form follow the instructions

Easily sign the form with your finger

Send filled & signed form or save
How to fill out the CCRESA 15 Minute Scatterplot Data Sheet online
This guide provides a clear and comprehensive approach to filling out the CCRESA 15 Minute Scatterplot Data Sheet online. Whether you are a teacher, observer, or other user, follow these straightforward steps to ensure accurate data collection and reporting.
Follow the steps to effectively complete the data sheet online.
- Press the ‘Get Form’ button to access the data sheet and open it for editing.
- At the top of the form, write the date on which the observations are being recorded.
- In the designated field, enter the student’s name to specify who the data pertains to.
- Fill in the school name and the grade level of the student to provide context for the observations.
- Identify the observer or observers by writing their names in the specified field.
- In the 'Describe Behavior' section, list specific behaviors observed, such as 'hitting' or 'kicking', instead of using general terms like 'aggression'.
- Utilize the provided key to categorize the observed behavior for each 15-minute interval.
- For each time interval listed, mark the corresponding box based on whether the behavior occurred, did not occur, or if there is no data available.
- Complete this process for all time slots provided throughout the day.
- Once all data is filled out, you can choose to save changes, download, print, or share the completed form.
Begin completing the CCRESA 15 Minute Scatterplot Data Sheet online today to ensure accurate and effective data collection.
Experience a faster way to fill out and sign forms on the web. Access the most extensive library of templates available.
Related content
by RL Cunningham · 2008 · Cited by 19 — Data were analyzed through the use of Pearson...
Get answers to your most pressing questions about US Legal Forms API.
How to put 2 sets of data on one graph in Excel?
To place two sets of data on one graph in Excel, organize your data in adjacent columns. Highlight both datasets, navigate to the 'Insert' tab, and select 'Scatter' from the chart options. This approach allows you to display your data effectively, enabling you to draw conclusions from the CCRESA 15 Minute Scatterplot Data Sheet.
How to make a scatter plot with multiple lines in Google Sheets?
To create a scatter plot with multiple lines in Google Sheets, input your data in a structured format across several columns. Once your data is ready, highlight the relevant data ranges and select 'Insert' then 'Chart.' Opt for a 'Scatter chart,' and you’ll effectively visualize multiple data trends similar to what's portrayed in the CCRESA 15 Minute Scatterplot Data Sheet.
How to make a scatter plot with two sets of data sheets?
Creating a scatter plot from two different data sheets involves copying the data from each sheet into one consolidated location. After merging the data, select it, and use the chart feature in your software to create a scatter plot. This method helps visualize relationships clearly, as outlined in the CCRESA 15 Minute Scatterplot Data Sheet.
How do you structure data for a scatter plot?
To structure data for a scatter plot, organize your data into two columns, where one column represents the X values and the other the Y values. Make sure your data points are numeric and well-defined. This clarity enhances the usefulness of the CCRESA 15 Minute Scatterplot Data Sheet, guiding your analysis effectively.
How to plot a Scatter graph with two sets of data?
Plotting a scatter graph with two sets of data is straightforward. Place your two datasets in separate columns, highlight both, and select 'Insert' followed by 'Chart.' Opt for a scatter chart type, and you will generate a visual representation that can help you interpret the CCRESA 15 Minute Scatterplot Data Sheet accurately.
How to make a graph comparing two sets of data on Google Sheets?
To compare two sets of data in Google Sheets, start by placing your data in adjacent columns. Highlight the data you want to graph, then click on 'Insert' and select 'Chart.' Choose the 'Scatter chart' option for a clear visualization of both sets, and leverage the CCRESA 15 Minute Scatterplot Data Sheet for insightful analysis.
How do you complete a scatter plot?
Completing a scatter plot involves adding your data points accurately and labeling your axes for clarity. You should include a title that reflects the data, as well as a legend if applicable. By following these steps, you can effectively utilize the CCRESA 15 Minute Scatterplot Data Sheet to present your findings.
How to make a quick scatter plot in Excel?
To create a quick scatter plot in Excel, first input your data into two columns. Next, select your data, go to the 'Insert' tab, and choose the scatter plot option from the Charts group. Once selected, you can customize your scatter plot and enhance your understanding of the CCRESA 15 Minute Scatterplot Data Sheet.
How to organize data for a scatter plot?
Organizing data for a scatter plot involves structuring your data points in pairs that correspond to their respective variables. A clean table format works well, ensuring that all data is easy to read. The CCRESA 15 Minute Scatterplot Data Sheet can help you format your data clearly and efficiently for effective analysis.
How do I add data to a scatter plot?
To add data to a scatter plot, simply determine the new values for your x and y variables. Then, plot each new point in relation to the existing points already on your graph. Using the CCRESA 15 Minute Scatterplot Data Sheet can make it easier to keep track of these updates and ensure accuracy.
Use professional pre-built templates to fill in and sign documents online faster. Get access to thousands of forms.
If you believe that this page should be taken down, please follow our DMCA take down process here.