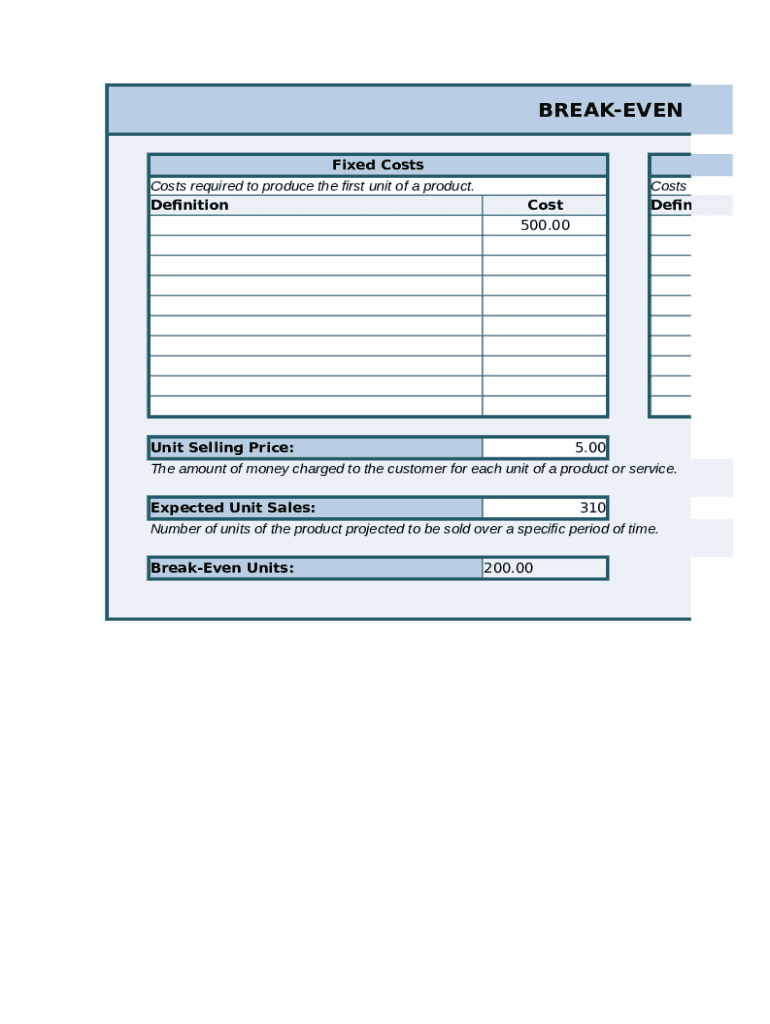
BREAKEVEN ANALYS Fixed Costs Costs required to produce the first unit of a product. DefinitionCosts that vary dire DefinitonCost 500.00Unit Selling Price:5.00The amount of money charged to the customer.

Open form follow the instructions

Easily sign the form with your finger

Send filled & signed form or save
How to fill out the Break Even Analysis Template online
This guide provides a comprehensive overview of how to effectively fill out the Break Even Analysis Template online. By following these steps, users can easily understand their financial situation and make informed decisions.
Follow the steps to complete your online Break-Even Analysis.
- Press the ‘Get Form’ button to access the Break Even Analysis Template and open it in your preferred online editor.
- Fill in the fixed costs section. These are the costs required to produce the first unit of a product. Enter the total fixed costs you expect.
- Next, input the variable unit costs. These costs vary directly with the production of one additional unit. Specify the variable cost per unit.
- Enter the unit selling price, which is the amount charged to customers for each product or service. This should reflect the price you plan to offer.
- Input the expected unit sales. This is the number of units you project to sell over a specified period of time. Be realistic in your estimation.
- Calculate and fill in the break-even units. This represents the number of units that must be sold to cover all costs. Your analysis indicates profit will begin after selling the break-even amount.
- Review all entries for accuracy. Make necessary adjustments to ensure that all financial figures reflected are precise.
- Once completed, save your changes, and you can choose to download, print, or share the filled-out template as needed.
Start using the Break Even Analysis Template online today to evaluate your financial outcome!
Experience a faster way to fill out and sign forms on the web. Access the most extensive library of templates available.
Related content
Do a breakeven analysis; Secure loans; Attract investors; Save money with tax deductions...
16, Chart: Displays break-even point, variable costs, fixed costs, ... 61, re-use this...
Defining the undesired (adverse) event is a political or policy judgment, further...
Get answers to your most pressing questions about US Legal Forms API.
How do you write a break even analysis?
To calculate a break-even point based on units: Divide fixed costs by the revenue per unit minus the variable cost per unit. ... When determining a break-even point based on sales dollars: Divide the fixed costs by the contribution margin.
What is a break even analysis example?
For example, selling 10,000 units would generate 10,000 x $12 = $120,000 in revenue. The yellow line represents total costs (fixed and variable costs). For example, if the company sells 0 units, then the company would incur $0 in variable costs but $100,000 in fixed costs for total costs of $100,000.
How do you create a breakeven analysis?
To calculate a break-even point based on units: Divide fixed costs by the revenue per unit minus the variable cost per unit. The fixed costs are those that do not change no matter how many units are sold. The revenue is the price for which you're selling the product minus the variable costs, like labor and materials.
What is break even analysis with examples?
Break-even analysis also deals with the contribution margin of a product. ... For an example, if the price of a product is Rs. 100, total variable costs are Rs. 60 per product and fixed cost is Rs. 25 per product, the contribution margin of the product is Rs.
How do you calculate break even analysis in Excel?
Variable Costs Percent per Unit = Total Variable Costs / (Total Variable + Total Fixed Costs) Total Fixed Costs Per Unit = Total Fixed Costs / Total Number of Units. Break-Even Price = 1 / ((1 - Total Variable Costs Percent per Unit)*(Total Fixed Costs per Unit))
What is breakeven point formula?
In accounting, the breakeven point formula is determined by dividing the total fixed costs associated with production by the revenue per individual unit minus the variable costs per unit. In this case, fixed costs refer to those which do not change depending upon the number of units sold.
How do you write a breakeven analysis?
To calculate a break-even point based on units: Divide fixed costs by the revenue per unit minus the variable cost per unit. ... When determining a break-even point based on sales dollars: Divide the fixed costs by the contribution margin.
What is breakeven point example?
Say your variable costs decrease to $10 per unit, and your fixed costs and sales price per unit stay the same. $6,000 / ($50 $10) $6,000 / $40 = 150 units. When you decrease your variable costs per unit, it takes fewer units to break even.
How do you create a breakeven analysis in Excel?
Breakeven point formula in Excel. There are 2 ways to calculate the breakeven point in Excel: Monetary equivalent: (revenue*fixed costs) / (revenue - variable costs). Natural units: fixed cost / (price - average variable costs).
How do you find the breakeven point in Excel template?
Break Even Point = $100,000 / ($1.20 $0.80) Break Even Point = $250,000.
Use professional pre-built templates to fill in and sign documents online faster. Get access to thousands of forms.
If you believe that this page should be taken down, please follow our DMCA take down process here.